This article is the first in a three-part series that is cross-posted from the ADS blog. In this series, the ADS team has performed an analysis of citations to astronomy journals over the last 20 years. This post is written by ADS project scientist Michael J. Kurtz and Edwin Henneken, who works on the ADS system development and operations.
This is the first of a series of blog posts measuring the journals which publish research astronomy articles, using citation statistics. In this post we describe the measurement process and the sample. The tables with the entire data set used are published in a Zenodo repository (DOI: 10.5281/zenodo.1400692).
ADS pioneered the use of citation indices on the WWW (Kurtz, et al, 1996) and they remain the third most used feature of the ADS (after the abstracts and full text). While various so-called alt-metrics have become popular, in particular forms of download measures (e.g. Kurtz and Eichhorn 1998, Henneken and Kurtz 2017), they are not yet widely accepted or used; citations remain the gold standard for scholarly measurement, particularly of journals.
Although the ADS has two main classifications for papers, astronomy and physics, simply choosing papers in the astronomy database is not a bibliometrically coherent method for choosing astronomy research papers. The database is designed to be useful to astronomers, not bibliometricians, and thus contains non-astronomy papers useful to astronomers. This biases the sample toward well-cited physics papers, and becomes more biased with time.
We have chosen to define an astronomy (or perhaps astronomy-relevant) paper as one which cites a paper from one of the main astronomy research journals. This should capture most of the breadth of the field.
The data were obtained via a series of ADS queries submitted via Python scripts to the API, one query for each year and journal pair. For example, this query returns astronomy papers published in Physical Review D in the year 2010:
bibstem:PhRvD year:2010 citations(bibstem:(ApJ OR ApJL OR ApJS OR AJ OR MNRAS OR A&A OR JCAP OR Icar OR E&PSL OR SoPh))
By this definition 38% of PhRvD papers are astronomy papers.
We ran these queries in the middle of July 2018 for each of the 20 years 1997-2016, and for each of the about 50 journals in the study (table 1). Some sets of journals were treated as a single entity, notably Physica (A,B,C,…), JGR(A,B,C,…) and the Physical Review, except for PhRvD and PhRvL, which were treated individually.
For each list of papers we obtained a set of five measures: number of papers, number of citations to those papers, h index, number of papers with 10 or more citations, and number of papers with 100 or more citations. Table 2 gives the data in the format: year, bibstem, measure, type of measure (e.g. num, cites, h, i10 or i100). Note that we have removed the ampersand (&) from the bibstems to aid the scripting.
We have also run the query on all refereed articles in the ADS; table 3 gives these results.
In the next blog posts we will examine individual journals; here we look at the behavior of the sample as a whole.
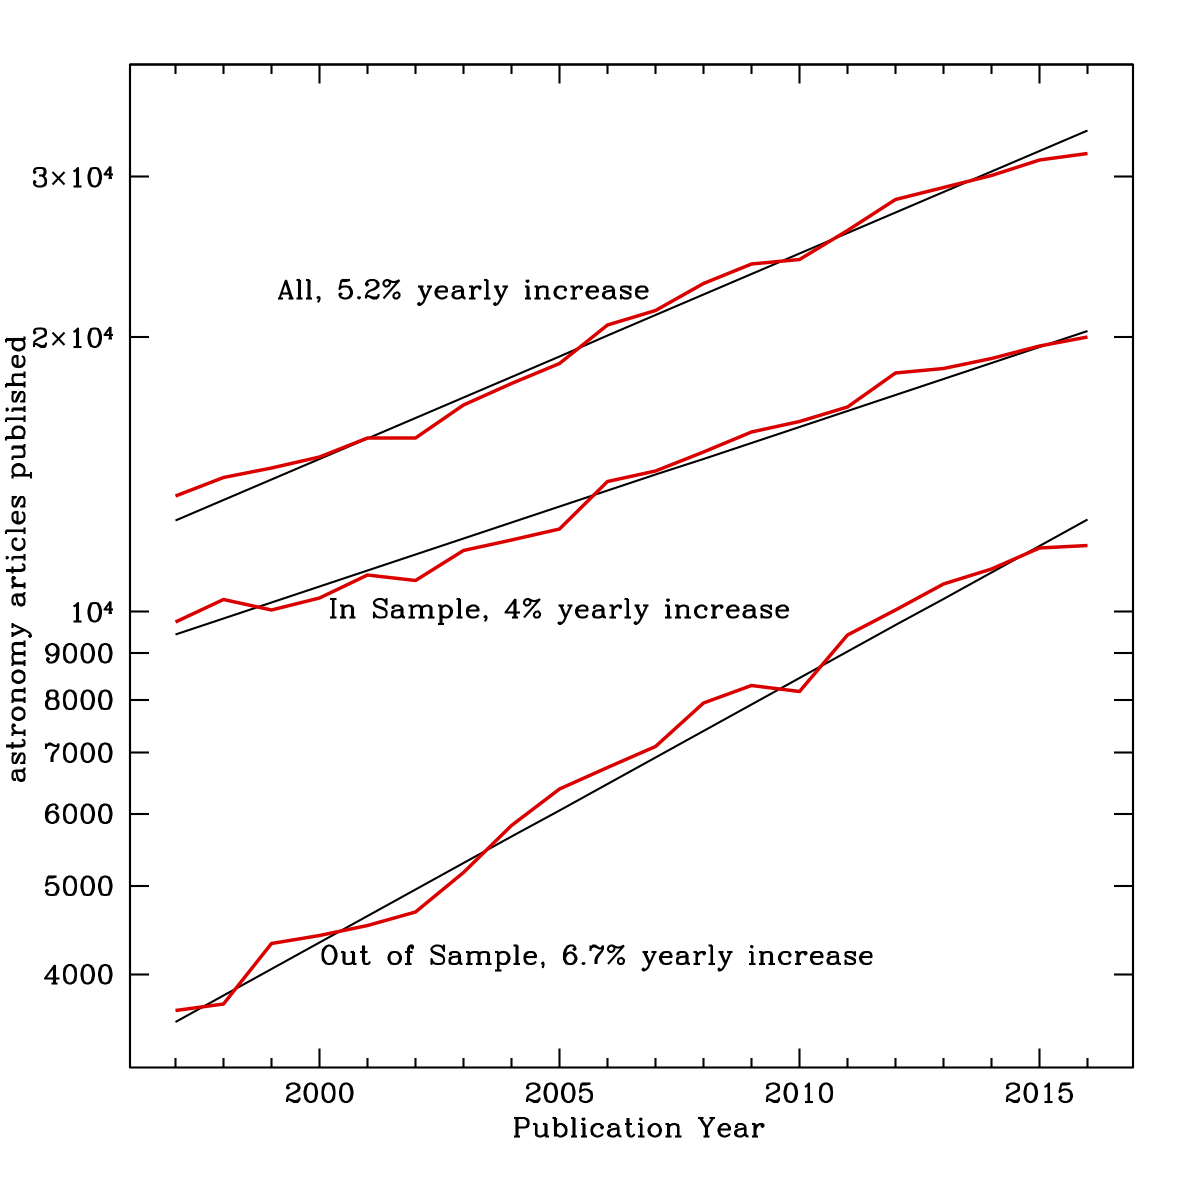
Figure 1 shows the growth in the number of papers over the 20 years of the study, for all refereed articles, those in the 50 journal sample, and the rest. The journals in the main sample (the In Sample set) are all major international journals; all astronomy journals which have published at least fifty papers with 100 or more citations in the last 20 years are included in this sample. The journals outside the sample (the Out of Sample set) are of two basic types: smaller, mostly national, astronomy journals, such as ARep, AstL, MmSAI, BASI, ChA&A, BaltA, etc., and journals which are not normally considered “astronomy” journals but which sometimes publish astronomy-related articles. There are more than 350 different journals which have published one or more astronomy-related articles which have received 100 or more citations in the last 20 years.
The In Sample group shows a steady 4% yearly increase in number of papers published, fully consistent with the growth of the scholarly literature over the last 350 years (de Solla Price, 1961). The Out of Sample group, with 6.7% growth, indicates the growing sphere of influence of astronomy.
Most of the Out of Sample journal articles are not from small astronomy journals (this has been steadily declining from about 10% to about 3% now); instead, they are from nearby physics/geophysics related disciplines. Assuming these fields are not growing any faster than the 4% rate of astronomy (or all science) we can conclude that the interdisciplinary reach of astronomy is growing by about 2.7% per year, a 25 year doubling period. As a percentage, the Out of Sample papers grew from 25% to 40% of the total during the 20 year period.
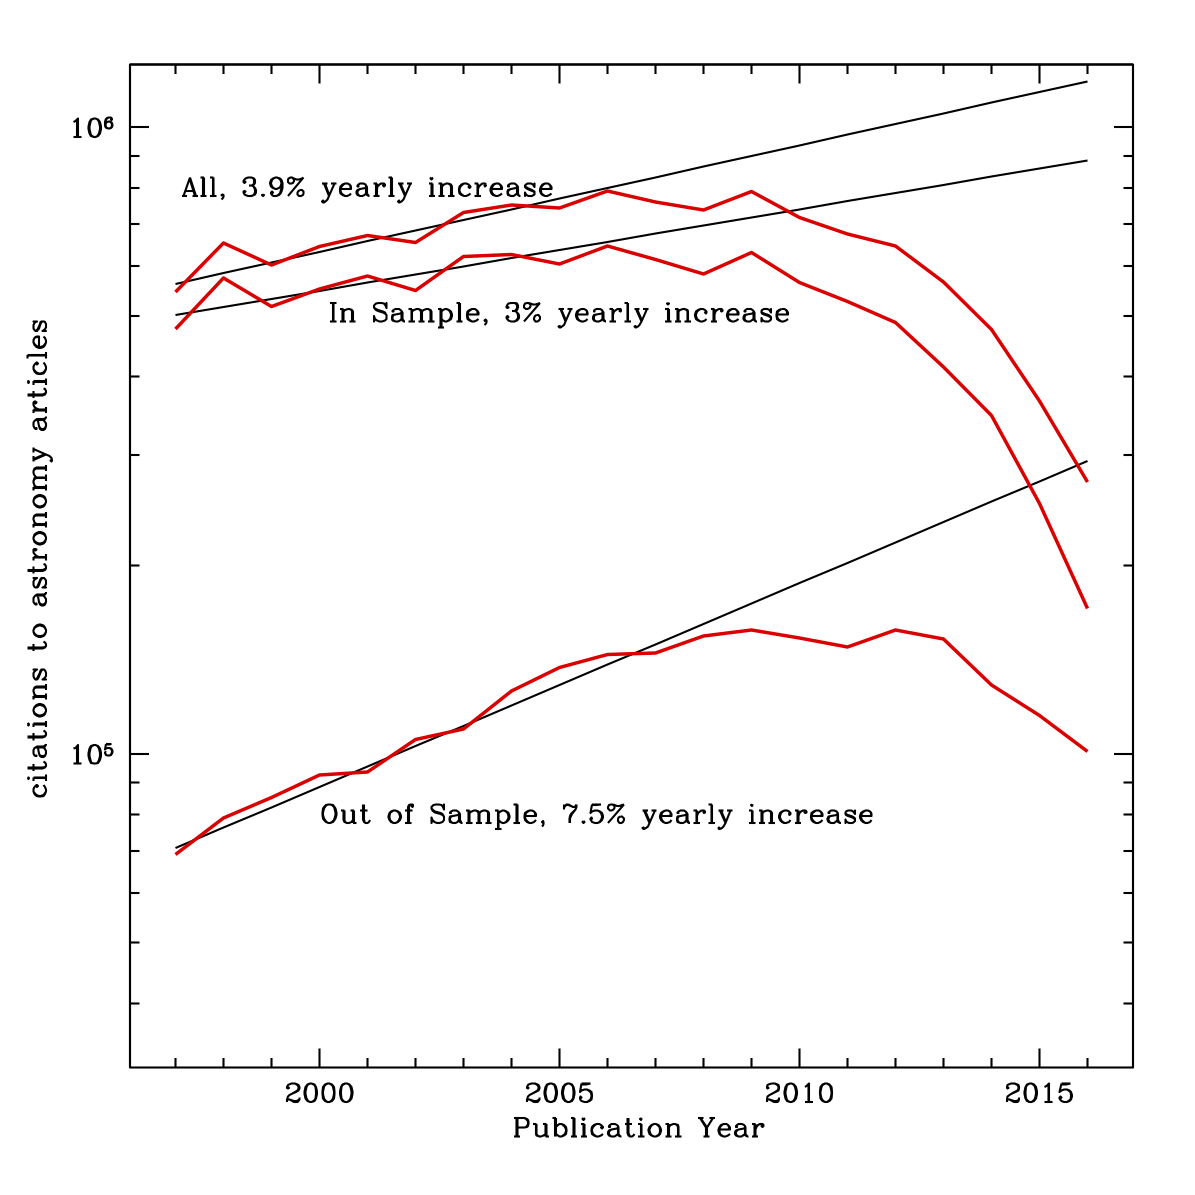
Figure 2 shows the total citations to the two sets (plus the sum) of articles as measured in July 2018. From the plot one can see that it takes about a decade before the increase in the number of citations over time is overtaken by the increase in the number of articles over time, creating a broad peak with a slow decline as we go back in time.
The asymptotic growth rate of 3% per year for the older In Sample journals citation counts is below the 4% growth rate for the number of articles published by these journals. Were the situation static this would imply that the number of citations per article is decreasing at about 1% per year. The situation is not static, and the mean number of citations per article is actually increasing. While the probability of a 20 year old article receiving a citation is only about 10% the probability that a recent article receives the citation (Kurtz, et al 2005), the number of available citations increases with the 4% yearly increase in number of articles and the 3% yearly increase of the number of references per article (Henneken, et al 2012), so after 20 years the total citation rate is still 40% of the initial peak rate. This, plus the fact that citations accumulate with age tends to flatten out this form of citation curve.
The Out of Sample articles present a different picture; the growth rate for citations is greater than for articles. Assuming that the same effects which affect the the In Sample articles also affect these articles, we are left with an unexplained residual growth in the Out of Sample citations similar to the additional growth in the number of articles due to increased interdisciplinarity.
We suggest there are a few factors at play here. The interdisciplinarity goes both ways, in that these articles not only cite core astronomy articles more often, they are also cited by astronomy articles more often. Second: articles in astronomy are substantially more cited than articles in related fields, such as geophysics; this is a function of the differing scholarly cultures, and tends to enhance the citations to geophysics articles which are of interest to astronomers. Finally the ADS data have a strong pro-astronomy bias (see the appendix to our recent white paper), which also tends to enhance this effect.
In this blog post we have presented the data which we will use to evaluate and rank the main international journals which publish astronomy research. We have shown that astronomy articles in these journals, as a whole, are increasing consistent with the centuries long trends in scholarship, and that the interdisciplinary aspect of astronomy research is steadily expanding.
COMING UP NEXT: We will publish and discuss 20 years of yearly rankings for the 50 In Sample journals for each of our five measures (number of articles, citations, h, i10, i100).