This article is the second of a three-part series that is cross-posted from the ADS blog. In this series, the ADS team has performed an analysis of citations to astronomy journals over the last 20 years. This post is written by ADS project scientist Michael J. Kurtz and Edwin Henneken, who works on the ADS system development and operations.
This is the second of a series of blog posts measuring the journals that publish astronomy research articles, using citation statistics with a number of different indices. In this post, we examine the performance of individual journals with respect to each other over time. We use the data described and published in Part 1, which looked at some of the integrated properties of the sample, such as citation counts and h-indices. In Part 3, we will look into some of the properties of the indices.
A. Ranked Lists
We begin by creating ranked lists of the 50 journals in the main sample for each of the 5 bibliometric indicators: number of articles, number of citations to these articles, h (Hirsch) index, i10 (number of articles with 10 or more citations), and i100 (number of articles with 100 or more citations). We do this for each of the 20 years (1997-2016) of the study. The appendix, published on Zenodo (DOI: 10.5281/zenodo.1400692), contains all the lists.
Much can be gleaned from these lists; we recommend the reader avails themselves of this opportunity. We will illustrate some of the results by a little cherry picking.
Below are excerpts from the lists showing the top 10 journals, according to the h-index, for the years 1997, 2007, and 2016.
1997 ApJ 154 2007 ApJ 154 2016 ApJ 48
1997 A&A 106 2007 MNRAS 116 2016 MNRAS 47
1997 ApJL 99 2007 A&A 115 2016 A&A 46
1997 MNRAS 97 2007 PhRvD 102 2016 PhRvD 42
1997 JGR 82 2007 ApJL 92 2016 ApJL 36
1997 AJ 80 2007 ApJS 75 2016 PhRvL 34
1997 Natur 72 2007 JCAP 69 2016 JHEP 32
1997 GeCoA 62 2007 AJ 66 2016 JCAP 30
1997 EPSL 61 2007 EPSL 66 2016 Natur 29
1997 PhRvD 61 2007 Natur 65 2016 PhLB 28
There are (at least) three main takeaways from looking at these lists:
- The Astrophysical Journal is no longer the dominant force it once was. Whereas in 1997 the ApJ had a much higher score than the second ranked A&A, in 2016 it is near parity with both A&A and MNRAS (which has a higher 2015 h-index than the ApJ).
- The geo/planetary journals have disappeared from the list. JGR, GeCoA and E&PSL were all in the top 10 in 1997 (Icar was #14); in 2016 the highest ranked geo/planetary journal is Icarus, at #20. There are some systematic cultural effects here (to be discussed in Part 3). Note that JGR in this context represents the total set of JGR journals (JGRA, JGRB, etc.).
- The physics journals have substantially increased their role in astrophysics research. In 1997 the only physics journal in the top 10 is PhRvD at #10, twenty years later there are 5 (counting JCAP as physics), with PhRvD at #4. Remember that this is for only those papers which are “astronomy related” as described in Part 1; they are a fraction of the papers published by these journals. For example in 2016 9% of the papers in PhRvL were astronomy related, as were 29% of the papers in PhLB.
B. Winners and Losers
As shown in Figure 1 of Part 1, the astronomy literature has been growing over the past two decades. While astronomy has spread its influence into related areas (and this is the point of that figure), the core astronomy literature can be taken as being within the ~50 major international journals of physics, astrophysics, and geophysics in our main sample (listed in Part 1). The growth of this literature has been a steady 4% per year, doubling over the period, consistent with long term trends in many disciplines.
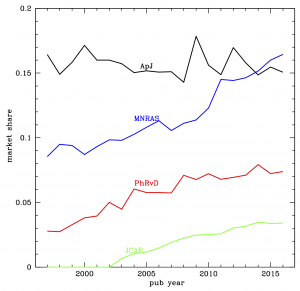
Not all journals have participated in this growth equally. Here we look at the biggest winners and losers in terms of market share, which we define as number of articles published. In the figures we show the changes in market share for the selected journals, defined as the number of articles published by the journal divided by the number articles published by the 50 in-sample journals (shown in Figure 1, Part 1).
Figure 1 of this post shows the three “winners”: MNRAS, PhRvD, and JCAP, as well as the ApJ, which has had an approximately constant share for the whole period (which means it doubled in size). MNRAS and PhRvD doubled their share (so quadrupled their size), and JCAP began at zero and now has a 3.5% market share.
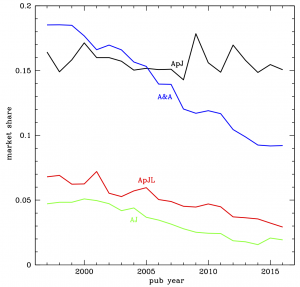
Figure 2 shows the three “losers”: A&A, ApJL, and AJ, also with the ApJ as a fiducial. A&AS was merged into the main journal in 2001; the A&A line represents the sum. All three journals lost about half their market share during the last two decades.
Market share is not the whole story, of course. It is possible to gain (lose) market share by becoming less (more) selective, for example. We define “mind share” as the fraction of citations a journal has relative to the whole field. In practice, we compute this by dividing the citations to each journal by the total “in sample” citations (shown in Figure 2, Part 1).
Note that the number of citations is as measured in the middle of July 2018; each year’s data has had a different period to accumulate citations. Also note that for recent papers (especially 2016) the citation counts rise very steeply with time; this suggests that the error in the estimated mind share for more recent documents will be relatively larger than for the older documents.
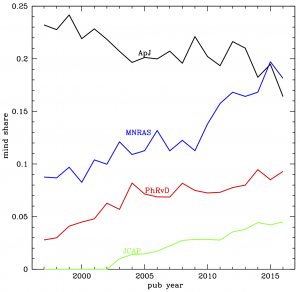
Looking at Figure 3, the first thing to notice is the decline in mind share for the Astrophysical Journal. The ApJ had an extraordinary presence 20 years ago, with nearly a quarter of all citations to astronomy related papers on somewhat less than a sixth of the total astronomy related papers. Now, the ApJ still has somewhat less than a sixth of the total papers but only slightly more than a sixth of the total citations (and thus mind share).
There are (at least) four possible factors in the decline in mind share of the ApJ:
- The ApJ has lowered its quality
- The average article has increased its quality
- ApJ articles are cited over a longer period than the average article
- The change from paper to digital affected ApJ mind share negatively
We suggest that the first factor is not correct and that the ApJ has not decreased in quality. All the other three factors contribute in some way. The ApJ has provided a standard target of excellence for other journals to aspire to, and many have. Older ApJ articles are cited more than the average older article. The end of the wall of paper journals in astronomers’ offices affected the leading journal, the ApJ, more than any other.
Were they to be gaining market share by lowering their standards, the slopes for MNRAS, PhRvD, and JCAP in Figure 3 would be shallower than in Figure 1. They are not; in fact they are slightly steeper, indicating an increasing rather than decreasing relative quality. Notice that MNRAS has a larger mind share than the ApJ for both 2015 and 2016.
Figure 4 shows the changes in mind share for the three journals that are the biggest losers in terms of market share (again with the ApJ as a fiducial). Were they to have lost market share by raising their standards, we would expect to see declines in mind share that are less steep than in market share. We do see that for A&A, while the ApJL mind share slope is the same as the market share slope, and the AJ mind share decline is even steeper than its market share decline.
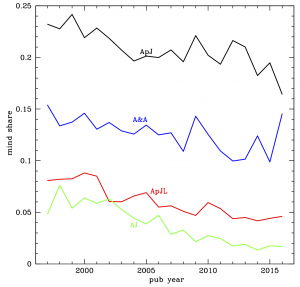
Over the last 20 years, A&A has steadily lost about half its market share, but less than a third of its mind share. While the spike in 2016, due to the highly cited Planck papers, may be ephemeral, the relative change in the A&A mind share has been remarkable. Twenty years ago A&A had a 10% larger market share than the ApJ, but a 35% smaller mind share; for 2016 A&A has a 40% smaller market share than the ApJ, but is (at least temporarily) near parity in terms of mind share.
Twenty years ago, the main journals in astrophysics began to publish electronically. At the same time, the number of ApJ articles preprinted in the arXiv exceeded 50% for the first time (it is now about 90%), and the number of astronomy research papers downloaded via the ADS exceeded the number read in all the world’s print libraries, combined, for the first time. The 20 years of this study correspond to the new era of electronic documents.
As the four figures (and the h-index discussion) show, this era has not been kind to the journals owned by the American Astronomical Society; the ApJ, ApJL, and AJ have lost their intellectual dominance. The recent structural and organizational changes to the AAS journals program may be understood in this light.
In Part 3, we will discuss per article citation rates (AKA Impact Factors).
How much of MNRAS growth is attributable to page charges? I currently have a little money in a grant, and when this runs out MNRAS is going to get all my submissions.
Yes, page charge is an issue for non-first world researchers. Taking into account the impact of MNRAS/A&A compared with ApJ/AJ, people shifted to journal with lower or even free page charges. Also, another topic to explore is about the spectacular growing of Chinese community. For my VO lectures using ADS, I’ve proposed an exercise to retrieve from ADS the number of refereed papers with Chinese affiliations, numbers are very interesting.
I think the decline in overall share has a lot more to do with the rise of scientific productivity and funding in the rest of the world, while the U.S. funding share for science has remained relatively flat. The number of people and institutions doing astronomy research has increased by lot outside of the United States. It has increased inside the U.S. too, but just not as rapidly as outside. I’m skeptical that the ApJ move to digital over paper is the driver behind this shift; that happened, yes, but that change is reflective of a technological change that has opened up our field to broader participation. The center of mass is changing, independent of our publication policies. To me, as long as these journals are high quality and not channels of pseudo science and (yet more) nonsense into our conversations, we can regard these trends as positive, even if they are challenging us to do more and better work in a rapidly changing landscape.