This is a guest post by Vandana Desai, a research scientist at the Infrared Science Archive (IRSA).
The Infrared Science Archive (IRSA) is part of the Infrared Processing and Analysis Center (IPAC) at Caltech. We curate the science products of NASA’s infrared and submillimeter missions, including Spitzer, WISE, Planck, 2MASS, and IRAS. In total, IRSA provides access to more than 20 billion astronomical measurements, including all-sky coverage in 20 bands, spanning wavelengths from 1 micron to 10 mm.
One of our core goals is to enable optimal scientific exploitation of these data sets by astronomers. Many of you already use IRSA; approximately 10% of all refereed astronomical journal articles cite data sets curated by IRSA. However, you may be unaware of our most recent visualization tools. We provide some of the highlights below. Whether you are a new or experienced user, we encourage you to try them out at irsa.ipac.caltech.edu.
IRSA Data Visualization
We now offer enhanced previews of data returned by IRSA’s basic image search. These new visualization tools are newly available for Spitzer’s Legacy Programs, Enhanced Imaging Products, COSMOS, and the Frontier Fields. Similar capabilities are shared by the Spitzer Heritage Archive, the WISE Image Service, the NASA Planck Archive, and Finder Chart v2 beta. Below we describe some of the main attractions.
♦♦♦ Preview images from IRSA, the web, or your disk, side-by-side ♦♦♦

Look for this icon next to an image search result to send it to the IRSA Viewer. In a given browser session, each image you preview will be sent to a single IRSA Viewer window. This allows you to customize the list of images you wish to inspect.
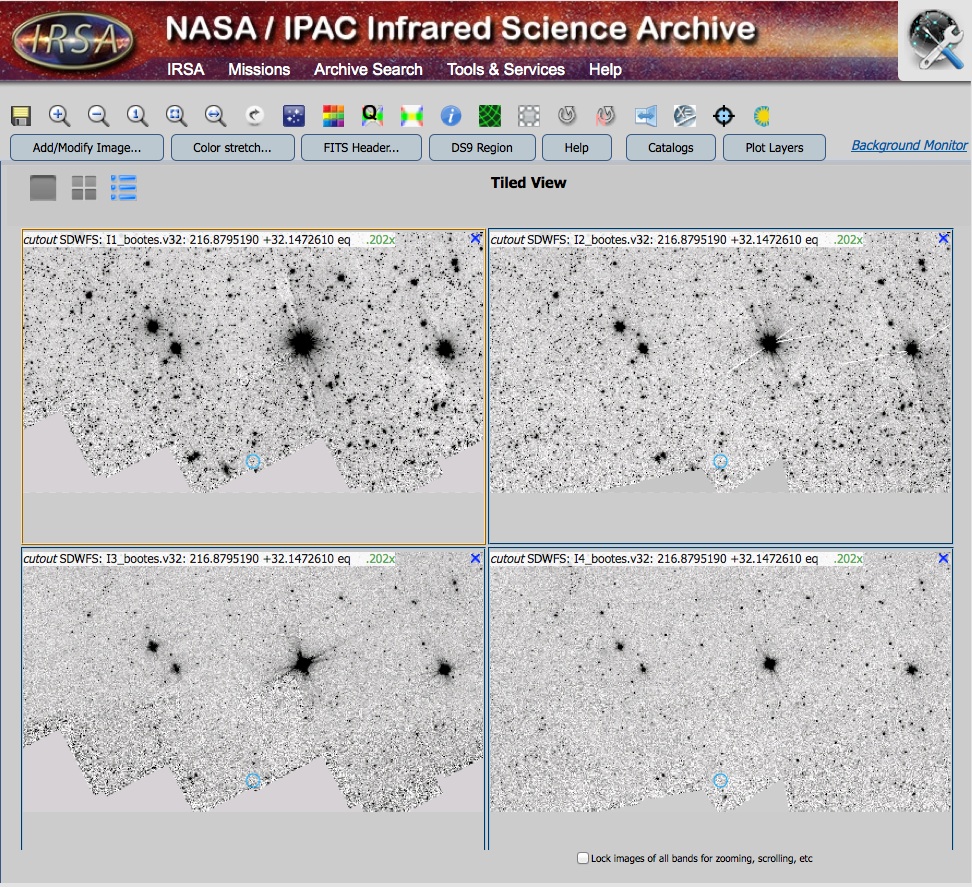
For example, searching the SDWFS Spitzer Legacy Program for images within 0.1° of 216.8795190 +32.1472610 results in 40 images, including images in different bands, different epochs, combined epochs, and coverage images. To get a multiwavelength view of the combined images, you can send just four of these images to the Viewer, one at a time. By default, you will get a tiled view of your selections:
To add an image from a different IRSA data set (e.g. IRAS, 2MASS, WISE), your local disk (e.g. your own groundbased data), or a web page, click on the “Add/Modify Image” tab (or the starry sky icon in the Tool bar) to include it in the grid. You can even create a 3-color image using this tool.
♦♦♦ Customize your view ♦♦♦
The toolbar provides everything you need to bring out the details of the image(s) that are important to you. Basic functions are just a click away:
- zoom
- recenter
- rotate
- color stretch
You can also create and manipulate a variety of overlays.
- coordinate grid
- marker of your choice
- ds9 region file
- compass rose
♦♦♦ Overlay catalogs from IRSA or your disk ♦♦♦
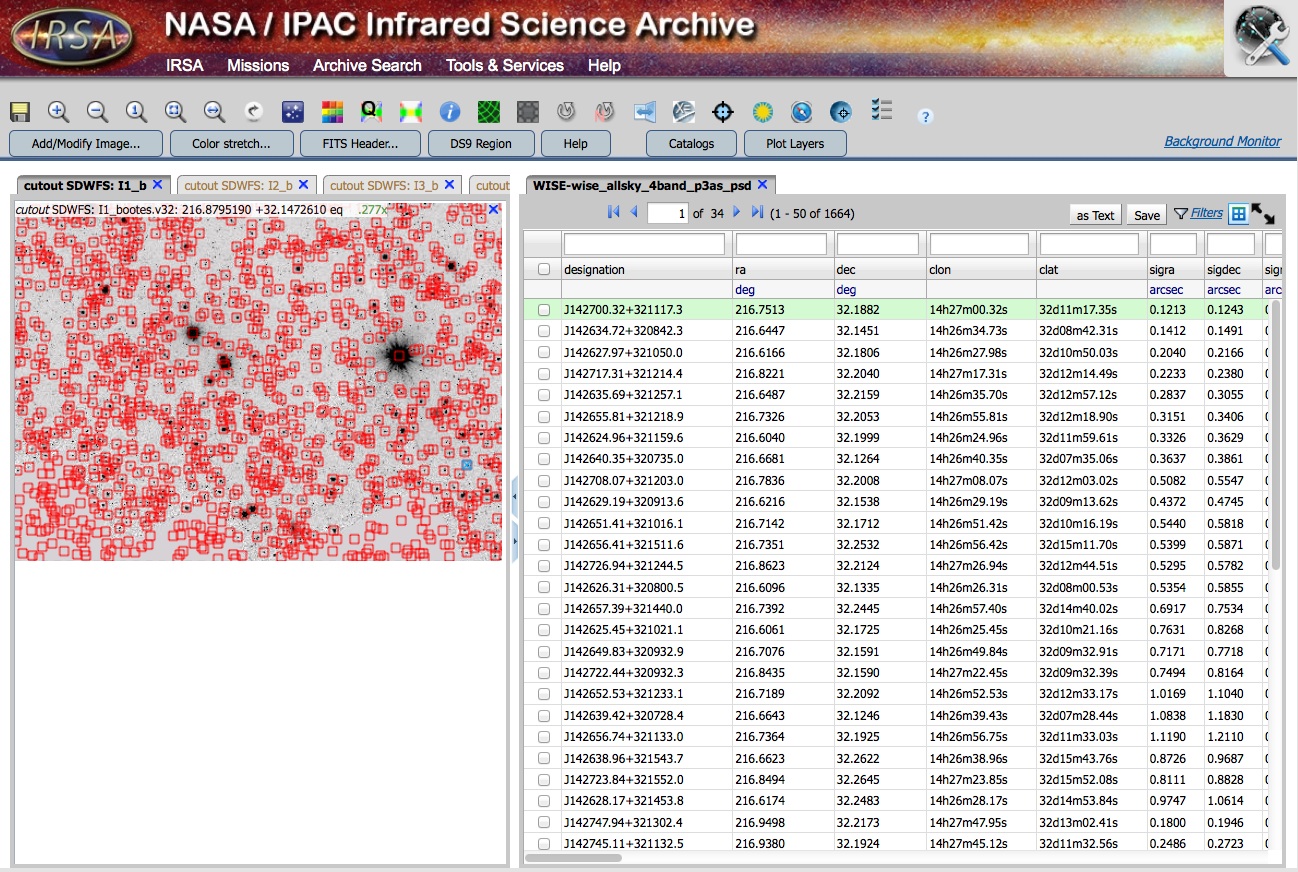
Using the Catalogs tab, you can select from the hundreds of catalogs available from IRSA, or one from your disk. IRSA serves several all-sky catalogs, such as WISE, 2MASS, IRAS, and Planck. The Spitzer Source List, along with many contributed data sets from Spitzer, are also available. See the complete list.

- The WISE All-Sky Catalog visualized on top of the SDWFS multi-epoch IRAC channel 1 cutout.
If you click on an object in the image, the corresponding row in the table will be highlighted, and vice versa. You can also sort the table by any of the columns, and specify constraints (e.g. > 12345, ! 3000) in the blank boxes above each column.
♦♦♦ Inspect your images ♦♦♦
In addition to visually inspecting your image(s), you can extract quantitative information about your image, including:
- FITS header
- Pixel information under cursor, or within specified subsection
- Distance and position angle between two points
♦♦♦ Learn more ♦♦♦
We’ve put together a brief video providing an overview of the IRSA Viewer:
Visit the IRSA IPAC YouTube channel or the IRSA Tutorials Page for additional IRSA Viewer tutorials.
IRSA Knowledgebase and Help Desk
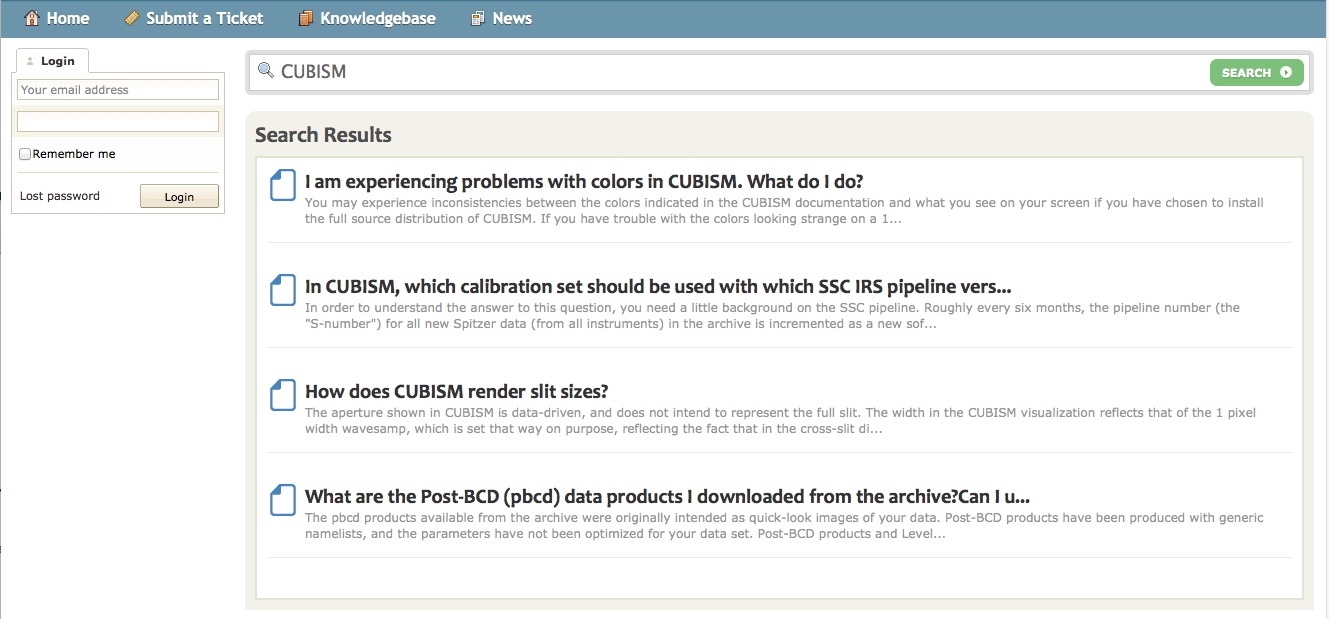
IRSA has a new searchable Knowledgebase within our Help Desk. The Knowledgebase contains answers to the questions we are most frequently asked. If your question is not adequately addressed there, submit a ticket containing your question. We have staff that are knowledgeable about the full range of data products and tools curated by IRSA and who are committed to providing an accurate answer, usually within 24 hours. In the screenshot below, you can see that you have the option to log in. This is not required to view the Knowledgebase or submit a ticket but, if you do, you will be able to track the progress of your ticket and all previous tickets that you have submitted.


Just a random question. Anyone playing with using WebGL to display the data?