This is a guest post by David “Coyote” Fanning. The Coyote is familiar to many of us since his web page, Coyote’s Guide to IDL Programming, is the most informative web page on IDL. He has been working with IDL software for nearly 25 years. He developed the first IDL training course and became the Director of Training at Research Systems, Inc., the original creators of IDL software. You can run into David most days, hanging out, answering questions, on the IDL newsgroup (comp.lang.idl-pvwave).
I’ve had a couple of Big Ideas in 25 years of IDL programming, but none bigger than the idea that struck me late one night, after several months of writing a new IDL book. “Wait a minute! I can duplicate all the functionality of the new IDL 8 function graphics commands, and I can do it with these old, traditional IDL commands that everyone already knows how to use!”
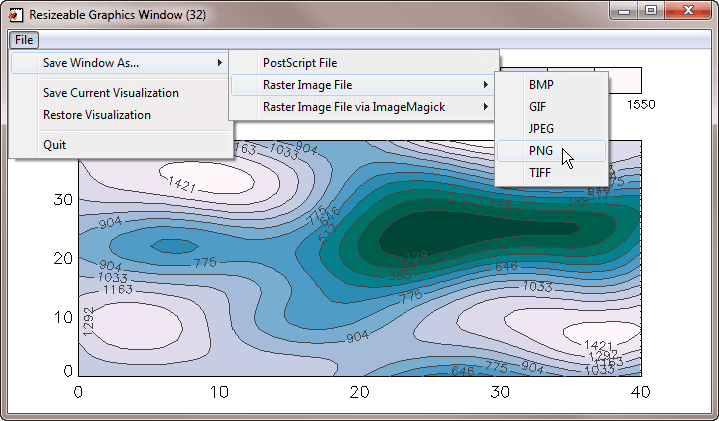
After an almost sleepless night, I was up at 5:30 the next morning, and an hour later I had a graphics system working. Everything was there: resizeable graphics windows, the ability to automatically save whatever was shown in the graphics window to a PostScript file, or to automatically save the contents to any of five different raster file formats, with professional looking fonts I didn’t have to be embarrassed to use in a presentation. A few minutes later, there were even fancy Layout keywords and the ability to save the entire visualization to a file so that it could be “recalled” at some later date, saved for provenance, or e-mailed to a colleague so they could be viewing the same visualization I was looking at. Wow! I’ve been excited about IDL before, but this was taking passion to a whole new level. The best part of the new system: you could use this new graphics system in any version of IDL. Even Coyote, cynical to his core, was impressed.
“Nobody will buy it,” he pointed out.
“You’re right about that,” I said morosely, thinking of my nearly non-existent bank account. “But, heck, let’s give it away! We’re more interested in fame than fortune, right?”
So that’s what we did. We are calling this the Coyote Graphics System. It pulls together programs from the Coyote Library, many of them renamed to better reflect their purpose, to create a complete graphics system that rivals any of the five new IDL graphics systems that have come and gone in the past 10 years, including the latest “new”graphics system, function graphics in IDL 8. But, unlike these new systems, this graphics system can actually be used and programmed by mortals to create new visual displays. Any data visualization you can imagine, you can create with the Coyote Graphics System.
There are two programs at the heart of the system. The cgColor program doesn’t care whether you are stuck in the past and will use indexed color until the day you die or whether you have moved on to the 21st century and want get your money’s worth out of that expensive 24-bit graphics card you bought for your computer, it always give you the color you ask for. And cgWindow is a resizeable graphics window that can be used almost exactly like you are currently using normal IDL graphics windows. These two programs can work with any traditional IDL command (e.g., Plot, Contour, Surface, TV, etc.), but the equivalent Coyote Graphics commands (e.g, cgPlot, cgContour, cgSurf, and cgImage) are designed specifically to work with these routines to produce device and color model independent programs.
What does this mean for you? It means you can write one program and have it work and look exactly the same on your display and in a PostScript file. It means you can stop apologizing about the poor quality of IDL graphics displays when you are presenting your results to your colleagues. And it means you can spend more time doing science and less time fooling around with recalcitrant graphics programs.
Wayne Landsman has already converted every plotting routine in the NASA IDL Astronomy Library to Coyote Graphics. Other astronomy libraries are doing the same. You can do this, too, with programs you have already written. My new book, Coyote’s Guide to Traditional IDL Graphics: Using Familiar Tools Creatively ($70 softcover limited time pre-publication price, $90 softcover, $60 PDF) explains the technique in detail. It is incredibly simple and Coyote Library routines have already been written to do most of the dirty work for you.
Here is what Ben Tupper, an IDL veteran and Mac user, had to say about the Coyote Graphics System when I introduced it to him:
I have just perused Chapter 12, “Using the Coyote Graphics System,” and I am thunderstruck (again!) by what a brilliant thing you have done for simple-to-use-right-out-of-the-box-but-wicked-powerful graphics. This is exactly what all of us need whether we are just cutting our teeth or we are getting long in the tooth. It’s freakin’ marvelous!
If you are tired of working with IDL graphics programs that look like they were written in the 1970s, I invite you to try something completely different. Here, for example, is how easy it is to create a filled contour plot in a resizeable graphics window.
IDL> cgLoadCT, 4, /Brewer, /Reverse IDL> data = cgDemoData(2) IDL> cgContour, data, NLevels=12, /Fill, Position=[0.1,0.1,0.9,0.75], /Window IDL> cgContour, data, Color='Charcoal', NLevels=12, /Overplot, /Add IDL> cgColorbar, Divisions=12, Range=[Min(data), Max(data)], XMinor=0, $ XTicklen=1.0, Charsize=1.25, /Add |
And here is the result. I think if you try these commands, it just might change the way you write IDL graphics programs forever!
So, please give the new Coyote Graphics a whirl and let me know what you think in the comments!
David “Coyote” Fanning you have once again saved me from endless hours of trying to figure out graphics in IDL. I love you man!
I’ve been trying out Coyote Graphics since David first introduced it, and it’s made a believer out of me. 🙂 If you spend any time doing IDL visualization, and particularly if you use it for both playing around with your data and for making paper or presentation-quality plots, it is well worth your time to go read about them (especially since the IDL astronomy library now uses them). The crucial routines are cgWindow, cgColor (previously known as fsc_color) and cgImage (previously tvimage) – there are other useful routines too, but those are the most important ones.
I got tired of using the new IDL8 Function Graphics system when a single (albeit complex) plot in my IDL astronomical image processing pipeline took ~3 hours to produce. I switched to CG, which could do everything the function graphics system could do, and my plots took less than a minute. WOW.
I now update my ASTROLIB and COYOTE folders often, and my plots are easy to code and work quickly and fabulously. I wish the rest of IDL was this easy to use, and if ITTVIS are smart they’ll include a copy of CG with the next release.
I had some problems with fsc_color and had written my own custom script to handle color. However, after the Coyote’s latest release, I have been using cgcolor. I have not had any problems; and as astrolib also uses cgs graphics, life is much better! Kudos!
**cough** matplotlib (http://matplotlib.sourceforge.net/gallery.html) **cough**
“Wayne Landsman has already converted every plotting routine in the NASA IDL Astronomy Library to Coyote Graphics.”
A fact that I discovered a few hours before the HST deadline and that nearly crippled my ability to make one of my proposal figures.
Wayne recognized there was a possibility of taking some heat for this, especially for switching to the more standard black on white color scheme instead the the traditional white on black. To that end, we incorporated a Traditional keyword that would apply to the Coyote Graphics routines that will restore the traditional color scheme. In all our tests, this caused the routines to work “normally.” Since this only “nearly” crippled you, presumably you found the keyword before too much damage was done. If there is something you need in particular, you need only ask. Our goal is to produce more robust and easier to use graphics commands, not to cripple the people who rely on our
software. In any case, I apologize for the inconvenience.