This is a guest post by Jeremy Sanders about the plotting package he’s developed. Jeremy is a postdoc working in the X-Ray Group at the Institute of Astronomy in the University of Cambridge in the UK.

Veusz (pronounced “views”) is a python-based GUI plotting package that I (Jeremy Sanders) have developed. As an astronomer, I was dissatisfied with every plotting package I had used. Some were fairly easy to use but old fashioned and/or limited (e.g., qdp, sm, grace, gnuplot). Several were not licensed freely (e.g., sm, idl). Many were difficult to use, requiring libraries of other peoples’ code or a lot of work going through manuals (e.g. idl). I wanted a free, easy to use and powerful package and so I started writing Veusz in 2004. Although I initially found the command line interface to be the most important part of a plotting package, since developing Veusz, I now use its GUI almost exclusively as it’s rather powerful and easy to use.
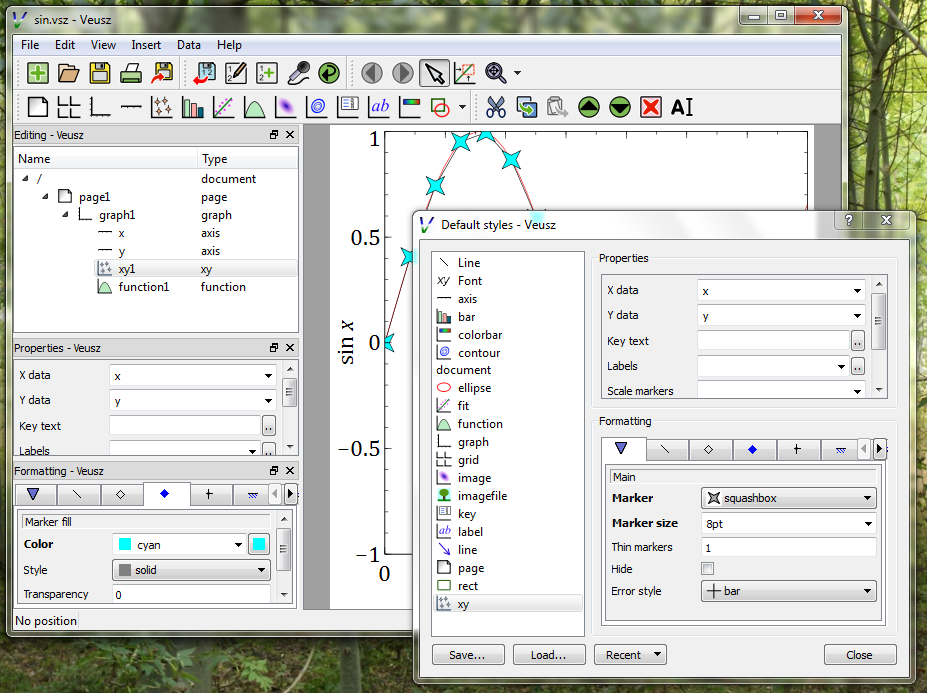
Veusz builds plots out of widgets, each of which has a set of properties and formatting options which can be modified. The standard way to build up the plot is to use the GUI to add widgets to form a tree, reading data from external files. However, most of the functionality can also be accessed using a command interface, which can be used from Python command line console window, an embedding Python module or commands sent to it from stdin. Indeed, Veusz saved documents are simply Python scripts using the same set of commands and are easily modified. Veusz can export several vector and bitmap formats, including PNG, EPS, PDF, SVG and EMF.
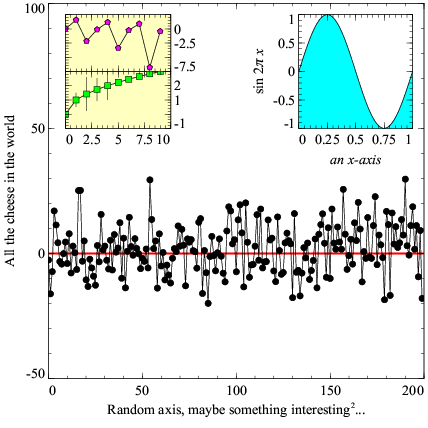
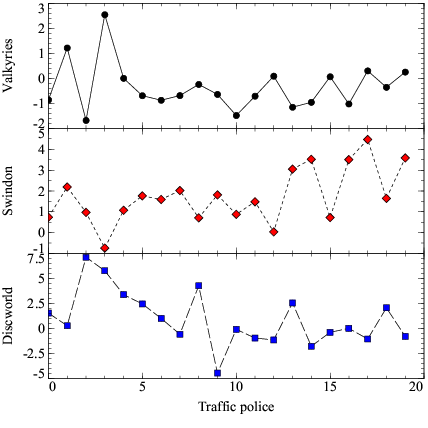
Veusz supports many types of graphs. Have a look at the page of examples. Veusz has scatter plots, with optional error bars (of several styles), joining-lines (stepped or beziers curves), fills and transparency, and allows for gaps in data. It also supports plotting functions (which can be defined using numpy functions or in external python modules), histograms (which can be computed from data), contour plots (including sub-contour levels and labelled contours), automatic data keys, image plots (with different color maps), color bars, shapes (including arrows) and external image files. It also has a function-fitting widget for doing a chi-squared fit to data. These plotting widgets are placed inside graph widgets. Multiple graph widgets can be placed on a page and in a grid widget which arranges the graphs inside it. Each graph can have as many axes as you like.
Veusz can read data in several different formats. It supports 1D numeric, date and text datasets, and 2D numerical arrays. Its default format is a simple space-delimited text format which can contain a descriptor describing dataset names, columns and data types, or specified in the program. It also supports CSV files (with an optional name for a dataset above each column). Importantly, it can load 1D and 2D data from FITS tables or images. And if that’s not good enough, you can send numpy arrays to Veusz using the embedding interface, or define an import plugin, which is a simple Python script for reading the data. A powerful feature is the ability to create new datasets in the program based on functions of other datasets. These datasets update automatically if the underlying data is reloaded.
Veusz is multiplatform as it is written in Python and uses PyQt for user interface and plotting. There are some small parts written in C and C++ to make the program faster. It relies heavily on the Python numpy libraries for handling data. Binaries are available for Linux x86, Mac OS X and Windows, and source allows it to be built for these and other platforms. It is licensed under the GPLv2.
Now, what it doesn’t do: It currently doesn’t have 3D surface plots or types of plots without independent axes at 90 degrees (e.g., pie chart, radar plot). The embedding interface doesn’t have a simple command for plotting like pylab, but it only takes a few lines of Python code to make a simple plot, and the object interface makes it very easy to manipulate the graph. Embedded plots can also be saved and loaded into the main GUI program for later editing. Its main feature which sets it apart is the unified command line interface which underlies the entire program. The program only supports Qt as a drawing backend, but this is easily extended to support other export files. For example the SVG and EMF export filters were written by me in Python. Veusz is also mostly a single-person software project, though I have included patches and ideas from other people.
What I’m currently working on is to add more general plugins allowing the user to add new dialog boxes to modify the plot and its data. I’m also going to add dataset plugins which would add the ability to define new ways to modify the data easily within the program without writing numpy expressions (e.g., FFT). I’ve just written code to improve the embedding interface allowing the user to treat the widgets in the document as Python objects (see the New style interface here). I’ve also added vector field plots and am looking into supporting new data formats (e.g., HDF).
The current version is 1.8. Please download and play with it! There are installation instructions, a manual, and a FAQ. Questions and comments are welcome below, on the mailing list, or directly to to me (jeremy at jeremysanders dot net).
Veusz (free), OS X [dmg] Windows [exe] Linux [tar.gz]
This program is amazing! Is there a simple way to edit (i.e. merge/split) the datasets after I’ve imported them? Or does that have to be done externally?
Patrick – you can create new datasets based on numpy expressions in the create dataset dialog. I think you should be able to do something like hstack((ds1,ds2)) to join datasets ds1 and ds2 (it’s a bit more difficult if they have errors). You can do ds[:100] to get the first 100 elements of a dataset ds into another dataset.
I’m adding some functionality to add “dataset plugins” which should make it easy to add dialog boxes to do common dataset manipulation.
I’m glad you like the program! Jeremy
Hi,
i like this program. it works well with mac. but i couldnt figure out how to insert error bars on. couldnt find an option to select the 3rd column in properties.
How can you create a contour plot from an imported dataset with Veusz? I seriously can’t figure it out.
Thank you!
It’s best asking questions on the mailing list, rather than here. The example plots are good ways to find out how to do things.
For a contour plot, you need to get your data in the form of a 2D dataset. This can be imported from a 2D matrix of numbers in the import dialog box (choose 2D), or you can convert 3 1D (X,Y,Z lists) datasets into a 2D dataset in Data->Create 2D. You can also create 2D datasets based on functional forms in the same dialog box.
Once you have the 2D dataset, it’s just a matter of adding a contour plotting widget and choosing it, though you may have to choose a minimum, maximum and scaling.
chaudry: I’ve just spotted your question (this isn’t a good place to leave them). Error bars are included in the dataset (it’s a set of data with its uncertainties), so there’s no separate way of selecting separate datasets for them. You can manually construct a dataset with errors by writing something like ds1,ds2 where ds1 has you values and ds2 has your symmetric errors. For asymmetric errors it would be ds,dsp,dsn (dsp and dsn are positive and negative errors. dsn must be negative).
Hi,
I want to import an image in fits format with its accurate wcs (viz. RA, DEC) coordinates. The problem is that my wcs coordinated are not linear, so i can’t use import with Linear(WCS). I somehow want to be able to either give x and y axis value as an array instead of just giving first and last value or be able to read my python code (which works well in this regard) in veusz. I couldn’t figure out any way yet.
Thank you.