3D interactive graphics in PDF Tutorial
by Josh Peek
Astronomy is by its nature a three dimensional science, and many of us have shared in the frustrations of not being able to show our 3D data in a way that is compelling within our major mode of communication, journal articles. In this post I will show you how to get your 3D information into PDFs in an interactive way, so that anyone, anywhere can explore it.
Adobe supports a version of 3D objects that you can view directly within PDF. Any up-to-date Adobe PDF viewer (Reader, Acrobat) will happily show you a figure you can click, drag on, zoom through. You can even navigate preset views that highlight particular aspects of your data. Indeed, the viewer is a rather clean interface, and very easy to use. The hard part is getting it there in the first place.
The code was first cracked by Alyssa Goodman and her team over at astromedicine and IIC with this article in 2007 showing a 3D molecular cloud. Early work was also done by the S2PLOT folks in 2008. When I first spoke to Alyssa about this, she was the first to admit that their process was Byzantine. The astromedicine initiative was designed to leverage the fact that medical imaging technology is a very well supported field. Unfortunately, while 3D medical scanning is well supported, it is often proprietary and always more complex than we need. A few years back I experimented with some of the technology from astromedicine, but came to agree with Alyssa that even for the emboldened astronomer-visualizer, it is a pretty steep mountain to climb. There exist a number of programs for 3D visualization of one’s own data, but the publication of 3D data in an interactive form was still very difficult for astronomers.
What follows is a documentation of the progress I have made in streamlining this process: starting with astronomical data and ending up with an interactive, 3D object within a PDF that can be happily published by journals. I am going to go over this in 3 steps.
1) Getting your data into a 3D format. I have had success with both simulation data and observational data. Along with Matt Turk I’ve developed a few codes I’ll share with you, but more importantly I’ll describe some more general things I’ve learned along the way that will allow you to write your own software for getting your data into 3D.
2) Augmenting and exporting. I’ll point you to a few pieces of consumer-level software that allow you to merge your objects into a single scene, change the colors and qualities of your objects in a GUI, and augment them with other 3D primitives and shapes. One can then export the whole mess in an arcane format Adobe and the PDF standard supports.
3) Formatting and Views. The last piece of the puzzle getting the scene into the PDF, looking how you want. Miraculously, this can be done entirely within LaTeX. I’ll discuss options you have for views and other ways of tailoring the 3D interactive experience of your figure.
1) Getting your data into a 3D format
The first thing you want to do is look at your data in some kind of easy-to-use form, so you can get a sense of what is reasonable to try to visualize. For me, the easiest tool for that job was NASA’s viewpoints software. I would take the positions of my data points in 3D and export them (along with any other qualities of interest) to a simple flat text file in columns. Viewpoints can happily read in these data and produce 3D visualizations of the (point) data, linked to other qualities. You want to see all your radio data in 3D with brightness temperature above 3 K? Viewpoints can do that. You want to see all your stars with temperature and log(g) within some range? Ditto. The nice thing about viewpoints is that it is extremely fast, and allows you much more functionality than exists within the 3D PDF status. The bad thing is that it is somewhat clunky and occasionally a little crashy. The yt project (http://yt-project.org/ ) can manipulate simulation (and observation) data in this manner as well, and is much better suited to multi-resolution AMR data than viewpoints.
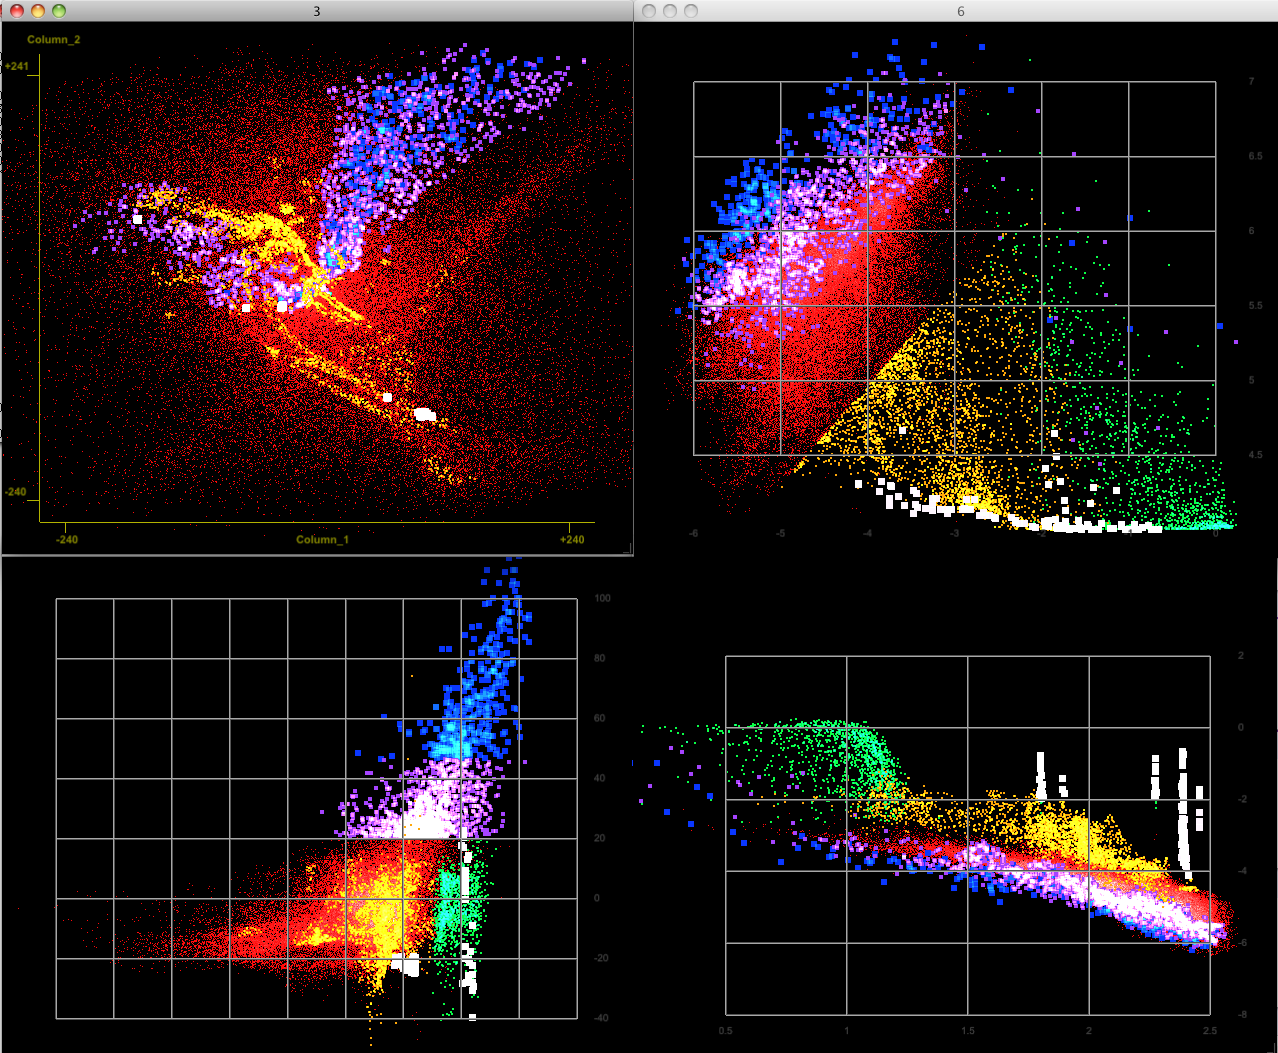
Some screen shots from viewpoints of simulation data. The upper left panel rotates in 3D.
While this method is great for looking at point-cloud data, Adobe’s 3D PDF does not easily support this kind of visualization; it is designed around objects with surfaces. The world standard for surface objects (called meshes or nodes by those who work with them) is a format called .obj. Any piece of 3D software should be able to read and write .obj formats without breaking a sweat. The good news is, making a simple .obj file is so easy it can be done in a text editor, and therefore with whatever language you code in. The bad news is that 3D PDF does not support .obj; it only accepts a format called .u3d, which is a poorly supported horrific mess. The game plan is first to get things into .obj format and then to convert. Stay with me; it’s not that bad.
The .obj format has a innumerable bells and whistles, and a more comprehensive description can certainly be found elsewhere. But, simply put, you tell it where the vertices are in 3-space and then tell it which vertices to connect to what. If you want a triangle floating in space, you can just make a .obj file containing only the plain text:
v 0.0 0.0 0.0
v 0.0 1.0 1.0
v 0.5 0.5 0.5
f 1 2 3
and you have a perfectly good 3D object file.
In my case, I had an object at known distance, and map on the sky that I translated to “thickness”. While most of the problems I solved to get from my data to a series of 3D objects are pretty specific to my own work, there is one annoying problem that I solved that might be more portable. As I show in my .obj file example, computer 3D objects are based on triangles (“tris” or “polys” in animator lingo). Unfortunately, a lot of astronomical data comes in square grids. If you imagine 4 data points in a grid at different heights, there are two ways to make a surface:
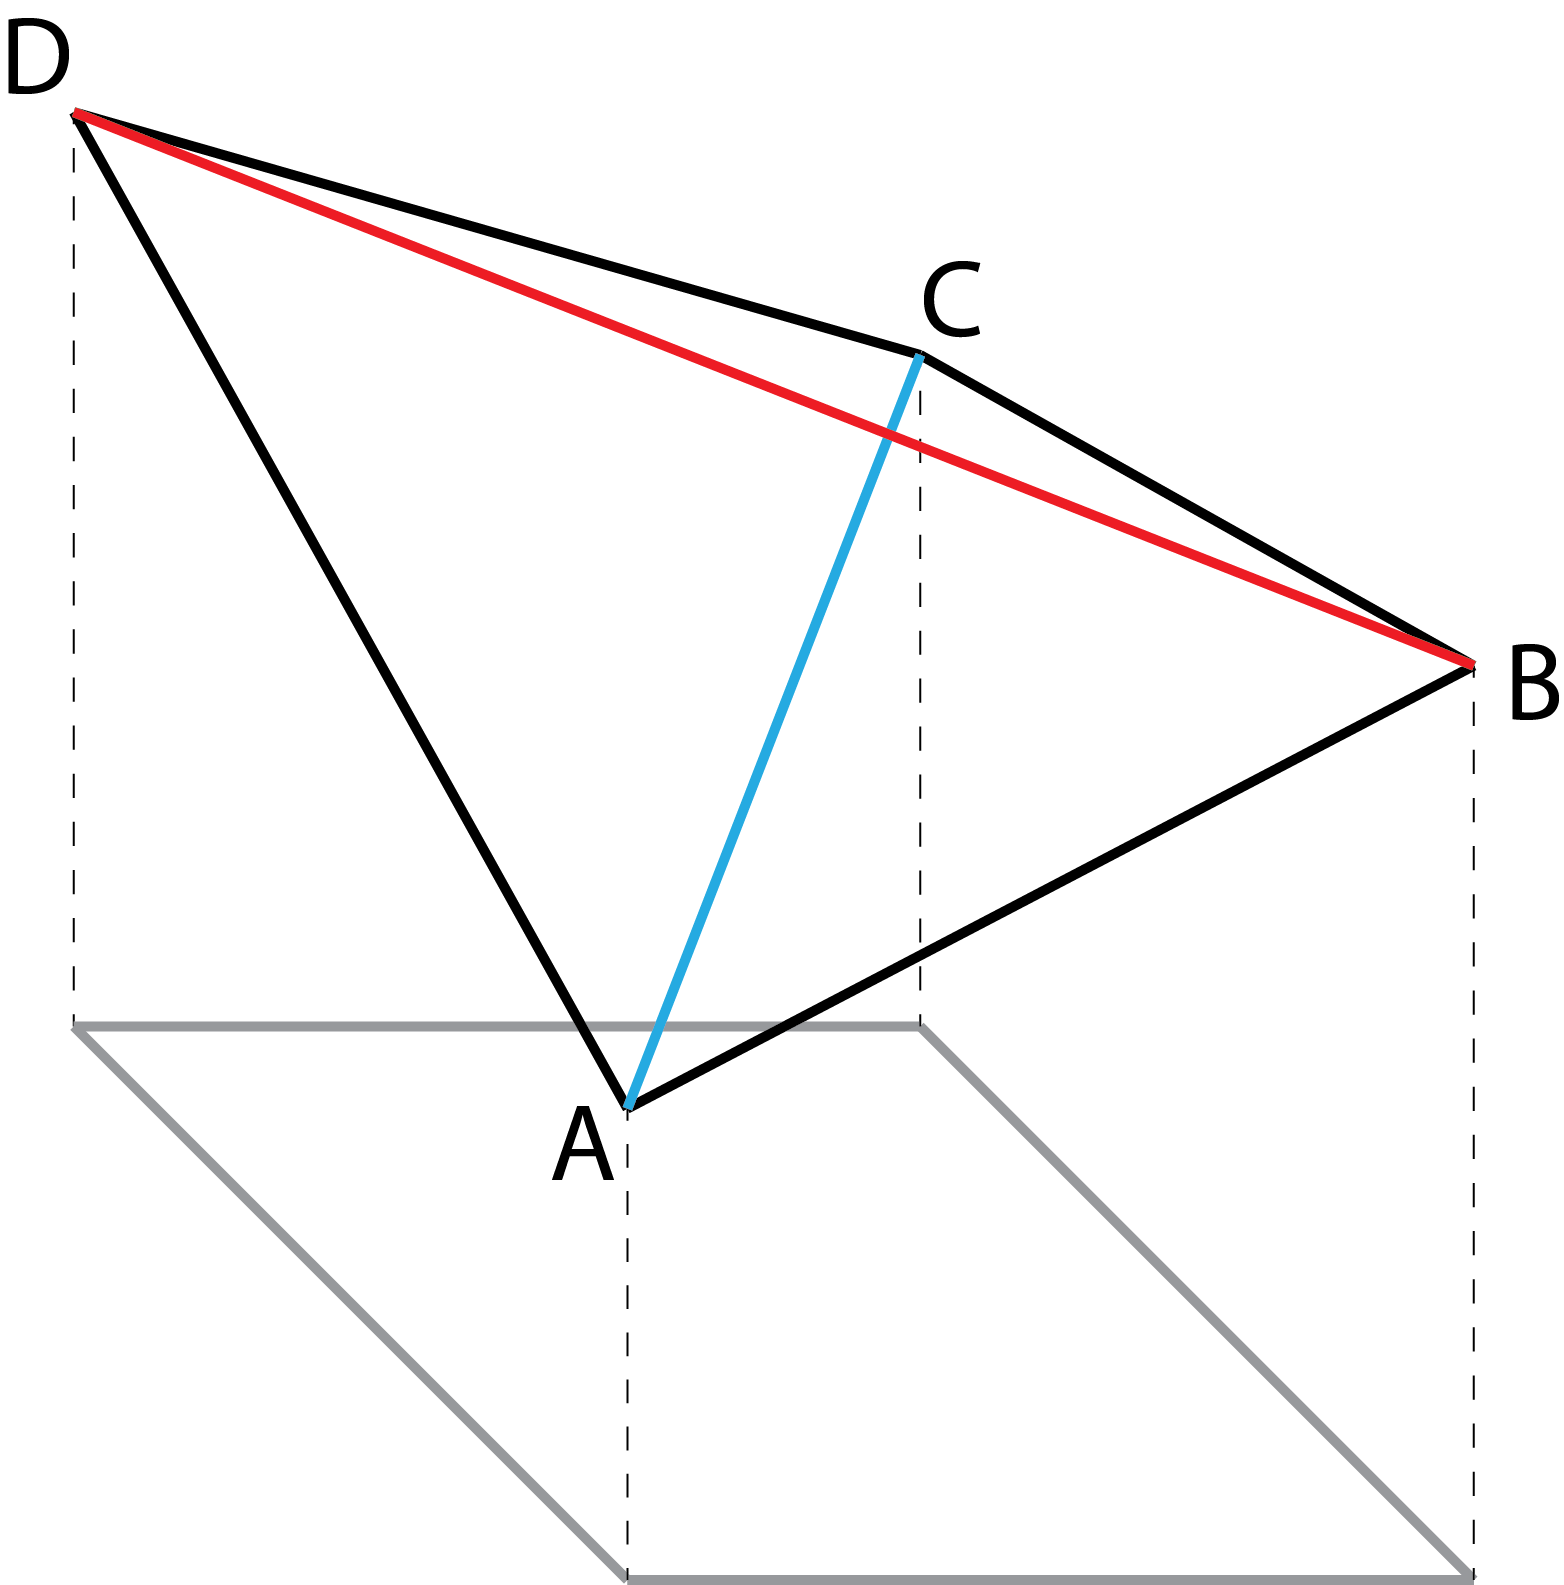
you can either make the triangles ABC and ACD or the triangles BAD and BCD. One can of course just always choose to split the same way for all quads of pixels, but you then end up with a somewhat weird looking object, with one diagonal much more visible than the other. It is simple to write a script that allows the user to choose the “closer” or “further” of the red or blue line and use that as the criterion for splitting the “quad” into two “tris” by just asking if the average of kitty corners is higher or lower than the opposing pair.
This simple method, finding the points you are interested in pre-defined 2D grid and then meshing between them, is good for many kinds of observational data. On the other hand, if have truly 3D data (some quantity on a 3D grid, T(x, y,z)) you may want to build iso-surfaces, much like the ones shown in Goodman et al. The most well-known way of doing this is what is called a “marching cubes” algorithm. There are likely many ways to do this with a arbitrary grid, but YT has made it relatively easy.
2) Augmenting and Exporting
There are many dozens of pieces of software out there for manipulating 3D objects, ranging from powerful (and expensive) animation software packages like Autodesk's Maya to easy-to-use (and free) programs like Google's SketchUp. Our minimum criterion is that the program needs to be able to import .obj files and export .u3d scenes containing many objects. One particular thing we want out of our program is that when the .u3d files that it exports are interpreted by the PDF the “tree” of objects is intact and looks the way we want it to.
These constraints narrow down our options considerably; unfortunately the capability to export to .u3d is a rather boutique feature, and very few 3D programs support it. Blender, the powerful open-source animation code supports export to 24 formats... none of them .u3d. I found two options online that could be downloaded without paying. Meshlab is an open source piece of code designed around playing with 3D objects. In principle it is a very nice tool, as it can apply a lot of mathematical operators to meshes, and it open source. In practice, I found the interface hard to use, the documentation lacking, and the program crashy. Additionally, it had trouble exporting object trees to .u3d with correct names.
The best bang for my buck was, sadly, a program called DAZStudio. It’s ugly, hard to use, poorly designed, and closed source. But it is free online at the moment, and can export correct object trees to .u3d. In one project I was working on I was able to import the various different clouds I was working on as .objs, add some models for the Galactic Disk and Bulge with simple primitives (cylinders, spheres), give the various clouds and models different colors, and export the whole thing to a single .u3d file readable into a PDF. One can also use paid programs like Deep Exploration and 3D PDF converter. After Acrobat 9, Adobe’s 3D editing functionality was largely spun back out to companies like Tetra 4D, and Right Hemisphere which now only develop for Windows and for big bucks. Sigh.
2) Formatting and Views
I’ll admit it: most of this article has been a bit of gripe-fest about how hard it is get 3D objects into PDF. Meshes are annoying! .u3d is a pain! 3D editors are difficult and expensive! But one big advance has happened since the pioneering work of Goodman et al. that makes this last step a joy: the development of the movie15 package. Alexander Grahn’s movie15 package for LaTeX allows the inclusion of movies, sounds, and 3D objects into PDF documents, and it works marvelously. As there is no real-time WYSIWYG feedback in LaTeX, one might imagine the process of editing the way a 3D figure appears might be a massive headache. Luckily, the authors have found a very clever shortcut around this problem, which I think is one of the smartest aspects of the software.
Once you have put together a scene with the appropriate collection of nodes (meshes or objects) and exported it to .u3d, all you need to do is download the movie15 package and call it within LaTeX. I have included an example from my own work here. Essentially \includemovie[] allows the user to supply the path to a .u3d file, a views file, and a ‘poster’ image (a flat image for those not viewing with a compatible PDF reader). Once the LaTeX is compiled, when you open the PDF with an up-to-date version of Adobe Reader, you should encounter a 3D object that can be happily manipulated with Adobe’s built-in 3D PDF functionality.
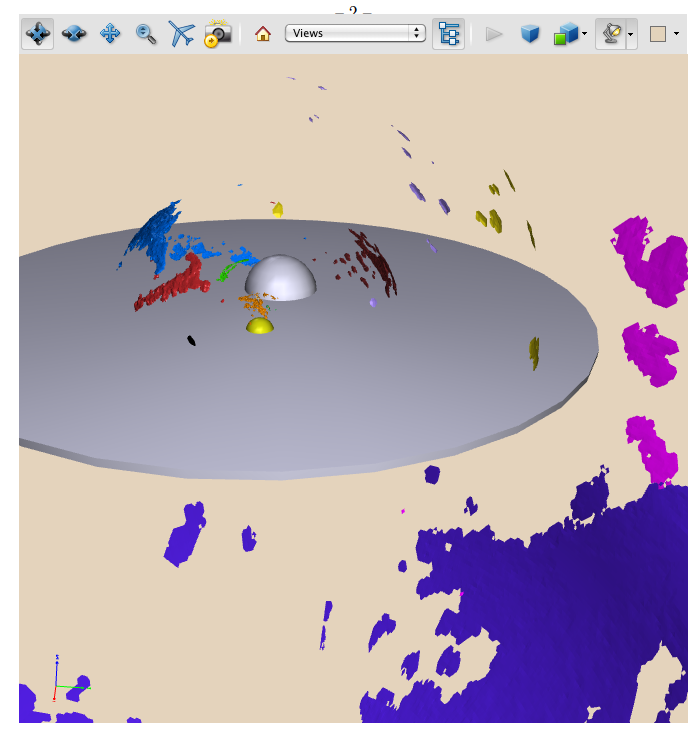
An example of a 3D scene as viewed with Adobe Reader 10.1.2
The key here is the concept of views. At the top of the 3D window a menu will appear that allows you to navigate around the 3D environment and select from a set of views defined within the views.tex file called within \includemovie[]. A view is not just the direction the camera is pointed and where it is situated; it also includes the color of the background, the way each object is rendered (transparent, opaque, wireframe, etc.), and how lights are implemented. As one might imagine, this is a long sequence of numbers and calls that would be impossible to write down in LaTeX without an interactive tool. This is where the brilliant \movieref3Dgetview call comes in. If you include \movieref3Dgetview in your LaTeX document, with an appropriate reference to the label you give \includemovie[], a javascript button will be embedded in your PDF document when you compile. Once you have set the view just as you like it, you simply click the button in the PDF. That button launches a new window with the LaTeX for your view written out in it:
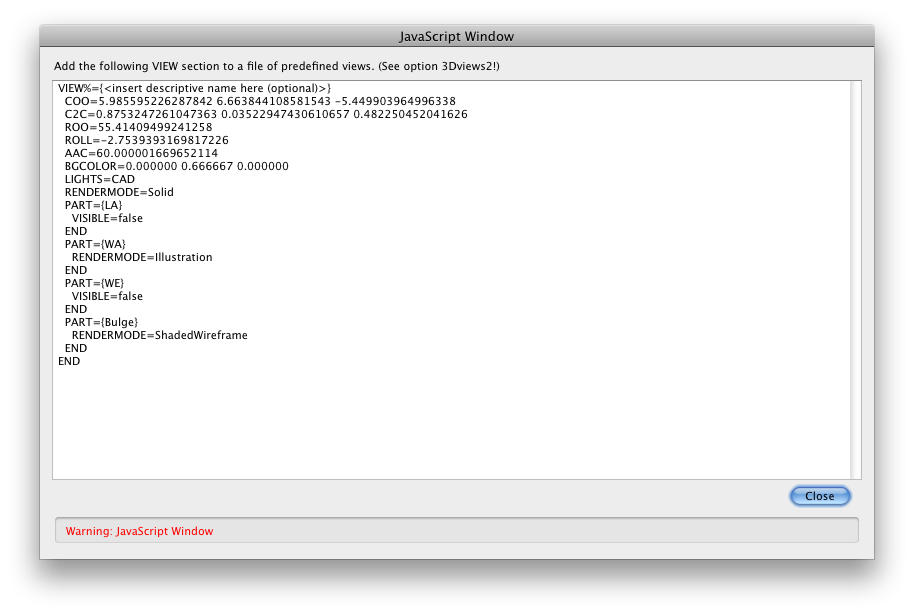
You simply copy that information into your views.tex file, recompile the PDF, and your view is now listed among the view options. This can also be done with the home view by putting the results into the \includemovie[] call directly, but note that the variables are slightly different (e.g. COO -> 3Dcoo), so a simple copy-paste needs to be tweaked to get the variable names correct. Once you have all the predefined views you like, you can simply comment out the \movieref3Dgetview call.
I will note that the definition of views can be done in a full WYSIWYG way using Adobe Acrobat X Pro. I am a big supporter of using the Adobe CS within astronomy, but I understand not everyone has it, and I certainly prefer doing it entirely within LaTeX. It has the particular advantage that the final PDF can be compiled directly from and can, in theory, be posted to astro-ph this way. In practice, many .u3d files are far too large for astro-ph’s stringent size limits, but there has been a suggestion that size restrictions could be waived for “efficiently encoded 3D objects”, or it could be included as an ancillary file.
I hope this little tutorial has emboldened you to try to include 3D objects in your work. Of course, all the standard rubrics for data presentation apply to 3D visualization as well. Focus on what you are trying to get across. Eliminate visual clutter. Allow the data to guide the method of presentation, not the other way around. This document is simply the results of my weeks of floundering trying to develop a simpler method for 3D PDF: if you find a better way to do any of these steps, please leave a comment!