 Converting astronomical data taken in multiple filters into representative-color RGB images often provides one of the most visually appealing (and informative) views of a target. This can be done in ds9 very easily; however, if you want a little more control, then python/matplotlib can be used in a very similar fashion. I also note that APLpy has excellent capabilities for images with proper World Coordinate System headers already (see the APLpy RGB tutorial). APLpy is far easier to use, but if you don’t have that choice, then you can use matplotlib as I am going to show below.
First, lets assume we are starting with three images, say J.fits, H.fits, and K.fits and that these images all have the same plate scale, the same angle, and the same position on the sky but lacks WCS information (as is often the case for ground-based OIR observations). Load up the images into numpy arrays using the pyfits module.
import pyfits import numpy as np import pylab as py import img_scale j_img = pyfits.getdata('J.fits') h_img = pyfits.getdata('H.fits') k_img = pyfits.getdata('K.fits') |
You can use pylab.imshow on a NxMx3 array; however, each layer of the image must first be mapped onto the luminosity scale. This is done with a module called img_scale.py that I borrowed from Min-Su Shin at U. of Michigan who very generously freely distributed his code (thanks!). You can get img_scale.py from this AstroBetter wiki page. Using this module you can linear, log, sqrt, or asinh stretch each color channel independently and set minimum or maximum flux values.
img = np.zeros((j_img.shape[0], j_img.shape[1], 3), dtype=float) img[:,:,0] = img_scale.sqrt(k_img, scale_min=0, scale_max=10000) img[:,:,1] = img_scale.sqrt(h_img, scale_min=0, scale_max=10000) img[:,:,2] = img_scale.sqrt(j_img, scale_min=0, scale_max=10000) |
Finally, we can display the image:
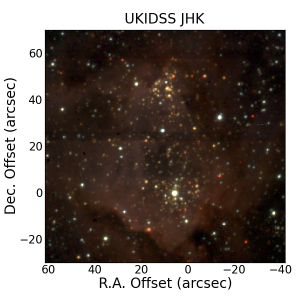
py.clf() py.imshow(img, aspect='equal') py.title('Blue = J, Green = H, Red = K') py.savefig('my_rgb_image.png') |
If your input images don’t have the same rotation angles, plate scales, or positions, then IRAF’s handy imlintran can be used to rescale, rotate, and translate. This can still be done in python via pyraf. Here is an example of calling imlintran from within python for a J.fits image that I want to rotate, shift, and rescale to match H and K images. I will assume the H and K images have a position angle of zero.
from pyraf import iraf as ir h_img = pyfits.getdata('H.fits') k_img = pyfits.getdata('K.fits') scaleK = 0.1 # arcsec per pixel scaleJ = 0.15 # arcsec per pixel) paJ = 30.0 # degrees ir.unlearn('imlintran') ir.imlintran.boundary = 'constant' ir.imlintran.constant = 0 ir.imlintran.interpolant = 'spline3' ir.imlintran.fluxconserve = 'yes' # the input pixel position of a reference source ir.imlintran.xin = 0 ir.imlintran.yin = 0 # the output pixel position of a reference source ir.imlintran.xout = 10 ir.imlintran.yout = 10 # Set the output size of the final image ir.imlintran.ncols = k_img.shape[1] ir.imlintran.nlines = k_img.shape[0] ir.imlintran('j.fits', 'j_rot_scale.fits', angleJ, angleJ, scaleK/scaleJ, scaleK/scaleJ) j_img = pyfits.getdata('j_rot_scale.fits') |
Alternatively, you can use scipy.ndimage.interpolate to shift images.
from scipy.ndimage import interpolation as interp old_j = pyfits.getdata('j.fits') new_j = interp.shift(old_j, [shiftY, shiftX]) |
The image attached in this post was plotted using imshow as described above and is a JHK color composite from the UKIDSS galactic plane survey.
This is really helpful! Thanks.
The APLpy documentation link is broken in the entry, you mean to link to: http://aplpy.github.com/documentation/index.html
This is really cool. I would also urge people to try FITS Liberator which is provided by ESA/ESO/NASA together with Photoshop (for those people who can afford it, or get it through other means). I like the method above as it is open source.
Out of curiosity, how would one create an RGB if the .fits data is from different telescopes, of different resolutions, alignments etc.? I’m trying to use aplpy but it doesn’t seem to want to take my HST and VLA data…
When i put import img_scale in my script, the code doesn’t work, you hace an idea why?
Thanks!
Thanks for this. Really helped a lot.