Yi-Kuan Chiang is a CCAPP fellow at the Ohio State University working on data-intensive survey astronomy and galaxy evolution. He is on a mission to promote the use of often underutilized diffuse photons in sky surveys across a wide range of wavebands.
Astronomers observe the sky in two dimensions, but we often encounter the major challenge of needing three-dimensional information to perform astrophysical studies. We are so happy to share with the astronomical community that Tomographer.org is now available to explore the third dimension (or redshift distribution) of source catalogs for which coordinates are provided or diffuse sky intensity maps at any wavebands. The concept and algorithm of this tool is developed by Yi-Kuan Chiang, and Brice Ménard, and the web platform is made by Manuchehr Taghizadeh-Popp.
The Tomographer uses the clustering redshift technique, which estimates line of sight distances by extracting coherent clustering signals between the input data and the extragalactic large-scale structure. The technique does not use any color information, and can be applied to sources selected in any homogeneous manner. It also works for diffuse, low spatial resolution intensity maps because even if the objects are not individually detected, we can still use the clustering information statistically. To get started with the app, upload a source catalog (with RA/Dec or Glon/Glat) or an intensity map in the Healpix format, and the Tomographer will infer its redshift distribution. The larger the dataset, the more accurate the resulting redshift distribution will be.
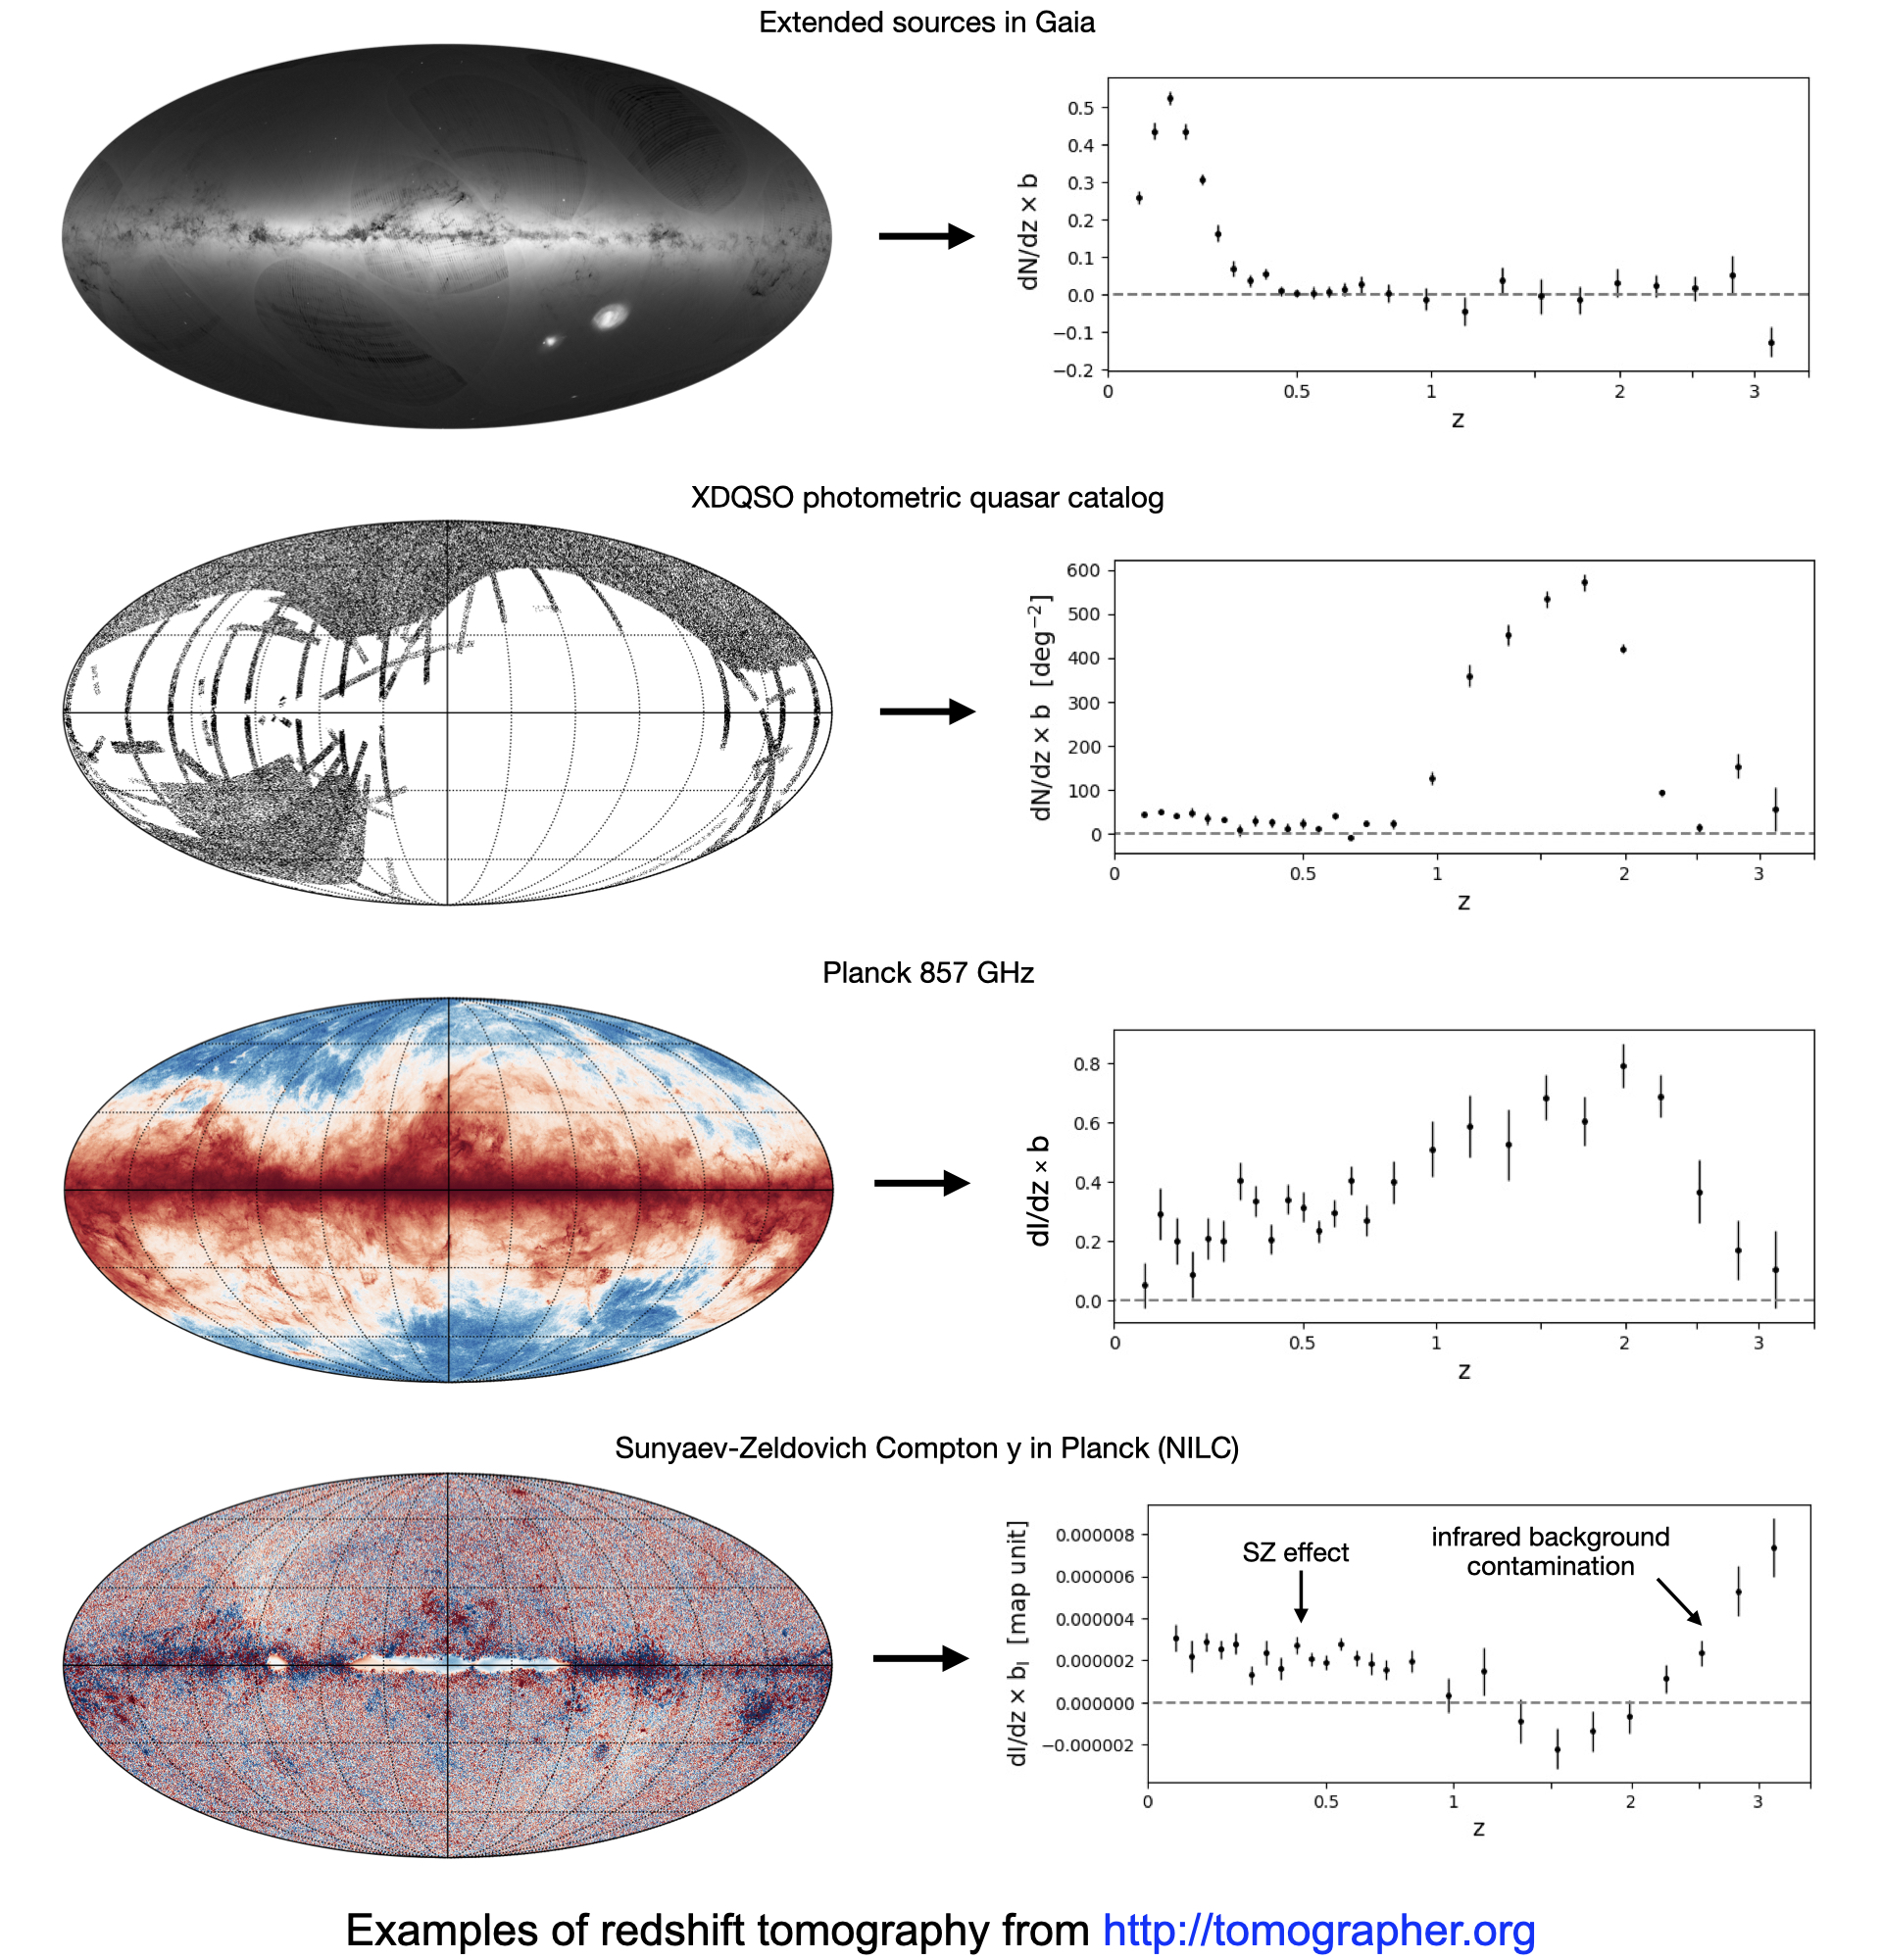
Some examples are displayed in the figure. The catalogs or maps on the left were uploaded to the Tomographer and the result redshift distributions are shown on the right. Depending on the input data, the result redshift distributions could be very different. For example, one of our first test users, Sihao Cheng, found that when selecting extended sources in the Gaia survey, which is initially designed to study stars, the result was actually a sample of galaxies with a peak redshift of 0.15. On the other hand, more distant objects can be found in catalogs like SDSS XDQSO, which is an optically selected quasar sample.
This tool can be used to address a wide range of astrophysical questions:
- What is the redshift distribution of my galaxy or quasar catalog, as demonstrated in the Gaia and XDQSO examples shown in the figure?
- How can I validate my photometric redshift estimates in a manner that does not rely on assumptions of the source’s spectrum?
- What redshifts contribute to the cosmic infrared background, as demonstrated in the Plank 857 GHz map example shown in the figure?
- What is the evolution of thermal gas pressure in the Universe probed by the Sunyaev–Zeldovich effect background, as demonstrated in the NILC example shown in the figure?
- Which region of color space contains sources at z>1?
- Is my star catalog contaminated by unresolved galaxies and quasars? (This would be indicated by finding components with non-zero redshifts, as stars are not clustered with extragalactic large-scale structures.)
- Is my Galactic dust map contaminated by the imprint of extragalactic contributions?
- Is my CMB map free of imprints from dust emission in the low-redshift Universe?
For a more in-depth example, I use The Tomographer in my recent paper to probe the far-infrared to microwave background light as a function of redshift, and use the result to constrain the evolution of the cosmic thermal energy density parameter Ωth.
To probe the redshift dimension of a source catalog or sky map, the Tomographer algorithm uses the so-called clustering-based redshift estimation (with the approach introduced in Ménard et al. 2013 and the specific implementation in Chiang et al. 2019). Clustering-based redshift estimation uses a set of spatial cross-correlations between a photometric sample, for which the redshift distribution is unknown, and a spectroscopic reference sample with known redshifts as illustrated in the figure below. One advantage of this technique is that neither the types of objects nor the wavelength considered in the two samples have to match, as the algorithm uses only spatial information but not colors. For example: one can probe the redshift distribution of photometric galaxies selected in the UV using spectroscopic quasars selected in the optical, as all extragalactic objects are clustered in the cosmic web.
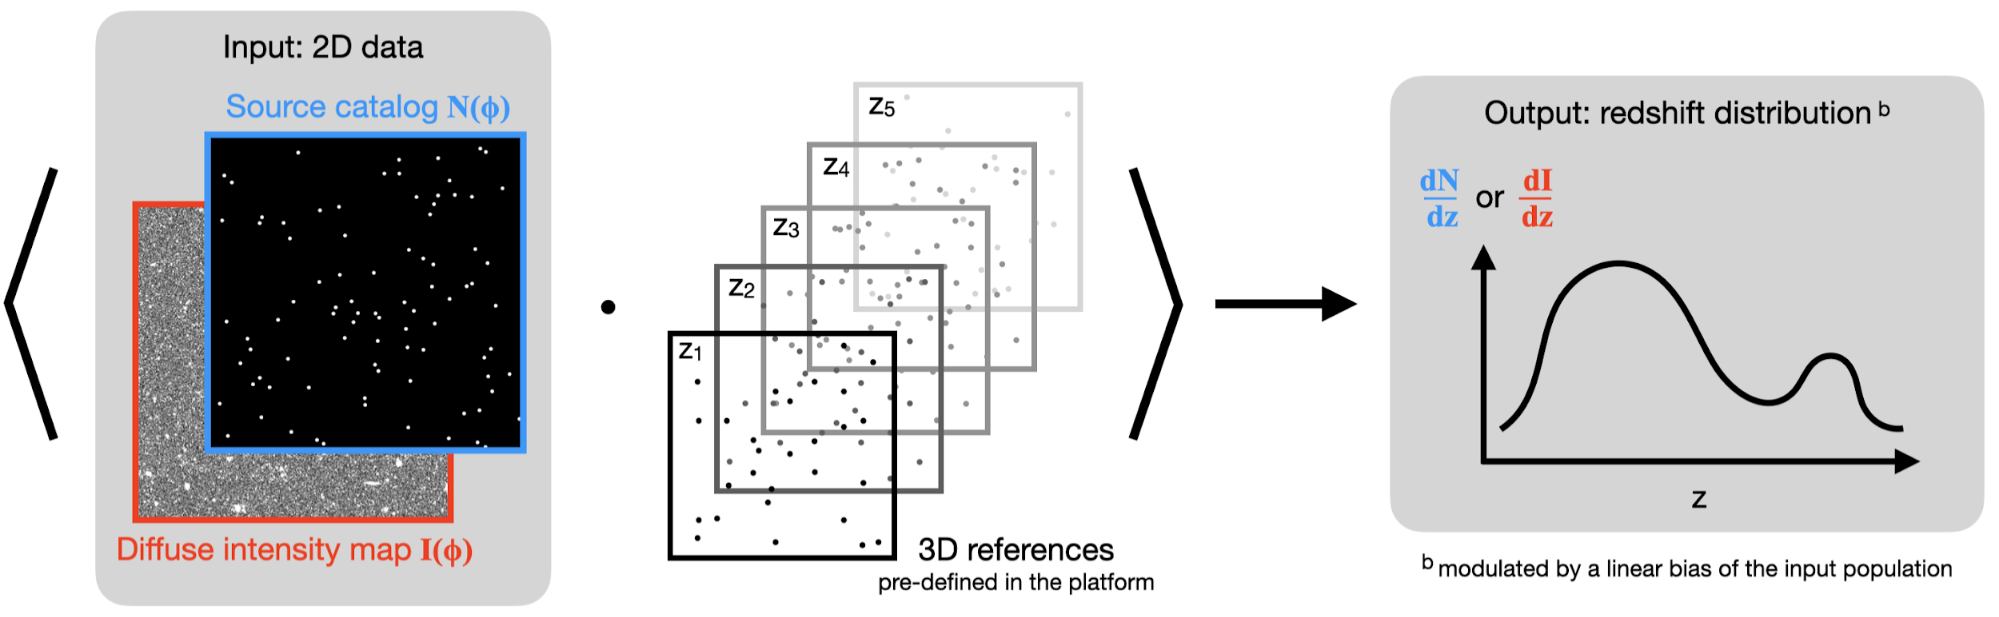
Clustering-based redshift inference requires computation of a large number of spatial correlation functions over a wide range of scales. To enable fast explorations of new astronomical datasets, this tool makes use of pre-computed spatial information to provide results in just a few minutes.
The online tool uses about 2 million spectroscopic sources from the Sloan Digital Sky Survey as the reference sample, which provides information of the cosmic web up to z=4. This reference sample will be expanded as new spectroscopic data becomes publicly available in the future. More details about the method are described in the technical documentation.
To use the app, go to website, create an account or enter as a guest, and follow the prompt to upload a source catalog or diffuse map. There are also example files provided if you don’t yet have a specific data set to explore.
Try it with your own datasets and let us know in the comments below if you have feedback or new discoveries that you want to share.