Here’s a common workflow: “I want to overplot a curve from the literature on my new plot. I could write the author and wait several days for them to dig up the plot file and send me the digitized version, but I want to compare now!” One solution is to digitize the published plot.
I used to use Dexter, but now I’m in love with GraphClick ($8, shareware.) Just screengrab the plot, paste it into GraphClick, click a few key points on the x and y axes and type in coordinates, and then either choose your data by hand, or use one of GraphClick’s curve-finding algorithms to automatically identify data. You can organize your digitized data into multiple datasets, which you can save as text files. Plus you can save the whole project, should you need to come back later and alter a fit.
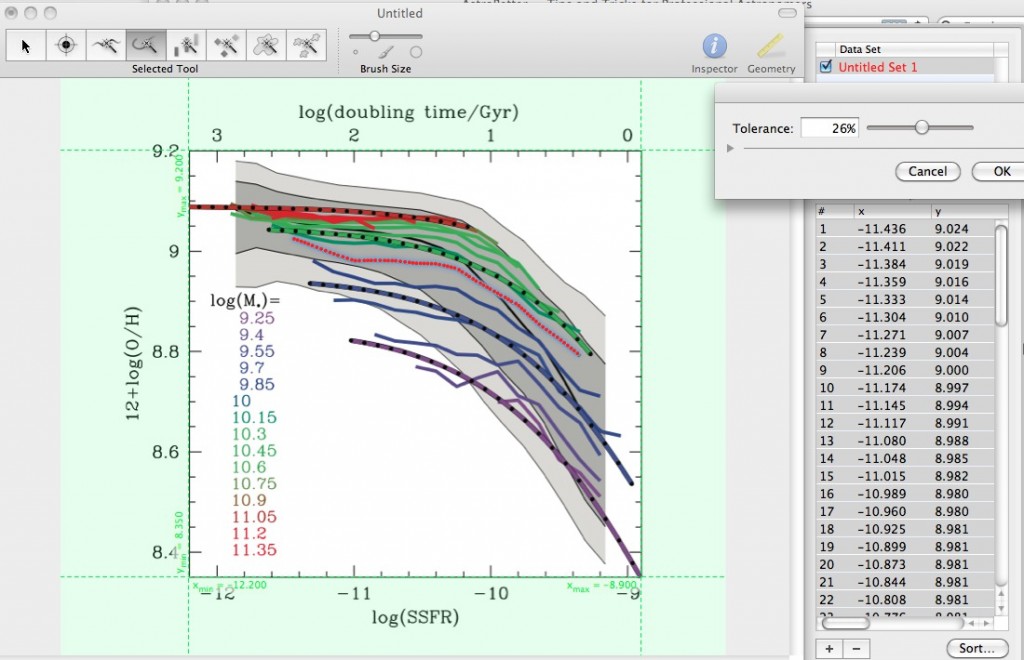
Here’s an example from a recent paper (Mannucci et al. 2010, Fig. 6). I used the curve-finding algorithm to follow one of the curves; the digitized points are shown by little red dots. This is a fairly perverse case, as there are multiple overlapping curves; but it took less than a half-hour, start to finish, including send the output text files to my collaborator.

Nice! Lately I have been pretty happy with PlotDigitizer (http://plotdigitizer.sourceforge.net/), it is free and does a good job retrieving the data points when you click on them. Of course an automatized algorithm is much better when you have plots with a lot of points. One thing I was wondering: there is a way of retrieving also errorbars?
Another alternative (mainly for linux users) is engauge:
http://digitizer.sourceforge.net/
EnGauge is also available for Mac, see here: http://naranja.umh.es/~atg/software-qt3.html . I’ve been happy with it.
WebPlotDigitizer also does the same job without needing to installing any software. It just runs in the browser. It’s not quite as slick as GraphClick and it requires you to hand-select your data points, but it gets the job done quickly if you just need a handful of points off a plot.
what a wonderful plot, it is really deserves a digitalization!
WebPlotDigitizer can auto select points for you, and has a couple nifty tools to let you search by color and in only certain areas of your plot. It did quite well at picking just the red points off an XY scatterplot, for instance. As Colin mentioned, it’s also free and doesn’t require downloading anything. Seems like a big improvement over Dexter!
Engauge has no distributions that are supported for Macs.
Felippo, I thought you might like that plot! 🙂 Of course I could have just asked you for the curves, but I wanted to exercise the digitizer program.
Thanks, Jane. This is great!
Dexter has an implementation that works in browser as well at http://dc.zah.uni-heidelberg.de/sdexter
What I was wondering, though, is whether there’s a tool to actually read vector points directly from PDF and thus eliminate the error introduced by centroiding the points during digitization?
Most such tools tend to focus on extracting data from a digitized bitmap, but if you don’t want to lose information your best bet is to extract the vectorial data directly from the figure. I only know how to do this with PostScript figures, and here’s how:
(1) Download the document source from the arXiv (select “Other formats,” then “Source”)
(2) Rip the desired PostScript code from the figure — this looks something like “m 5328.86,3663.79 -1.98,-1147.75…” — and save it into a text file. I use InkScape, which lets me click-select the curve I want and see the underlying code directly (in “Edit” –> “XML Editor”), and then I copy-and-paste it.
(3) Convert the postscript code into standard (X, Y) coordinates — I have a Python function to do this.
(4) Scale these arbitrary X, Y data to the correct coordinate scale, via careful measuring and/or comparison with outputs from the digitizers above.
The ability to do this is just one more reason to not submit figures as bitmaps. The other reason, of course, is that bitmap figures look ugly.
You can convert graph to numbers (i.e. data) using the im2graph graph digitizing software.
im2graph is free and available for Windows and Linux.
It’s very simple and intuitive to convert graphs to data.
See http://www.im2graph.co.il
Which of the above tools work with skymaps (showing RA/DEC) or (galactic latitude/longitude)? From a quick look, most of the tools discussed here seem to work with
cartesian coordinates.
Thanks
shantanu
All of you forgot to mention this one Plot Digitizer (https://plotdigitizer.com/). It is more user-friendly and stable.