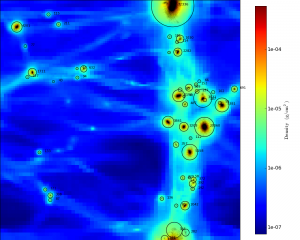
 More and more astronomers are writing, running, and using massive computer simulations. The complexity of these simulations (often 3D space + time) means that visualization can be challenging. Over at Astropython, they have posted about the – yt – toolkit that allows you to analyze and visualize the results of adaptive mesh refinement simulation codes (AMR). AMR codes are used to simulate the formation of cosmological large scale structure, the collapse of gas clouds to form stars, fluid dynamics involving shocks, jets, etc. The yt toolkit is written in python and works with several AMR codes including Enzo, Orion, FLASH, and preliminary support for RAMSES, ART, Chombo, CASTRO and MAESTRO. Data from one of these AMR codes can be sliced, diced, profiled, binned, and volume-rendered.
yt is described in Turk et al. 2010 and can be downloaded for free. The documentation includes a nice summary and orientation. I have updated our Python wiki page to provide links.
Have you used yt and what was your experience like? What are the similar visualization packages for smooth-particle hydrodynamics (SPH) codes?
Wiki: Python, Simulations
Thanks for the post about yt! We’re trying really hard to make sure that it’s useful for both quantitative analysis of data — fast, meaningful, parallel analysis of simulations from large to small — as well as for visualization. We have an image gallery with more beautiful, less quantitative renderings of various simulations, on our wiki. Feel free to drop by the mailing list or IRC, too.
SPH users should check out SPLASH (http://users.monash.edu.au/~dprice/splash/). It handles input from pretty much every big SPH code out there, written in F90 and very easy to use.
I’m a member of the yt development team, and I’d like to note that not only can yt be downloaded free of cost, the code is completely open source, and relies on no proprietary software. We are strongly committed to open science practices, as outlined in our principles, http://yt.enzotools.org/principles.html.
I’ll be posting a short introduction to SPLASH this weekend on the astrobites blog. Stay tuned!
I thought I would plug the package “VisIt”, put out by Lawrence Livermore National Labs (https://wci.llnl.gov/codes/visit/). It understands a very wide range of file formats and can do lots of slicing and dicing too. It understands regular grids, structured grids, and can even contour irregular grids (though getting your data into such a format can be tedious and non-intuitive).
My tip would be to use the netcdf file format to create 4d variables.
Hi Aaron. We’re actually in the process of putting into ParaView, and optimistically VisIt as well, the astrophysics-specific analysis modules that yt provides. As it stands, yt can (as of last friday) act as a programmable pipeline inside ParaView, and last week we started conversing with VisIt developers on utilizing yt as a plugin there as well.
This discussion is a few weeks old but I’d like to plug a project that a group of us have been working on since last fall called pynbody. It’s a python-based N-body/SPH analysis framework meant to simplify analysis by providing an intuitive interface for some of the most common tasks. We’re gearing up for a first public release in a few months, but the code is very much useable already so we would welcome brave beta-testers. It works transparently with gasoline/pkdgrav/tipsy as well as gadget outputs. We’re ironing out some tedious kinks with regards to installation etc. so we’re very much interested in any sort of feedback regarding those issues. Have a look at http://code.google.com/p/pynbody/ and let us know what you think!
There is a subset within the statistical community that focuses heavily on the best practices for presenting data. In particular there is a movement for implementing what is called the “grammar of graphics”. One implementation of this is in the free statistical software “R” with the package called ggplot2. As a statistician I believe it would be mutually beneficial for the astronomy and statistical graphics community to collaborate. Though I am not sure how these stat software packages can handle large simulations, it is still of interest to me. Here are links to the different packages I had mentioned.
Grammar of Graphics: http://www.amazon.com/Grammar-Graphics-Leland-Wilkinson/dp/0387987746
R: http://cran.r-project.org/
ggplot2: http://had.co.nz/ggplot2/