This is a guest post by Edwin Henneken, IT Specialist at the Astrophysics Data System based at the Harvard-Smithsonian Center for Astrophysics.
For many scientists, it’s all about the numbers and when it comes to evaluating each other, it’s no different. Project managers and administrators also want to be able to evaluate the impact of programs or instruments. As a result, publication and citation “metrics” are an important part of any researcher’s dossier. Like it or not, individuals and committees of all kinds use metrics to evaluate impact and performance of scientists. As a service to the astronomy community, the ADS is providing tools for calculating and visualizing these metrics within its brand new Bumblebee interface.
Bumblebee can calculate metrics on the results of any search but in this post, we will show how to calculate them for an individual author.
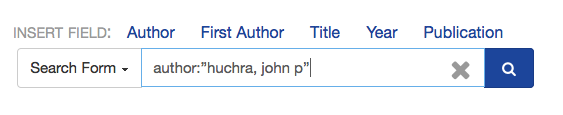
To get started, go to ADS Bumblebee and perform an author query:
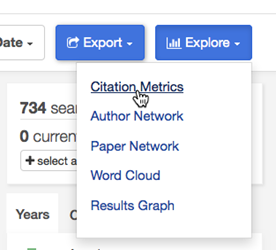
On the search results page, click the Explore button and select Citation Metrics:
The top panel displayed is a graphical representation of the search results as a histogram of the number of products published per year.
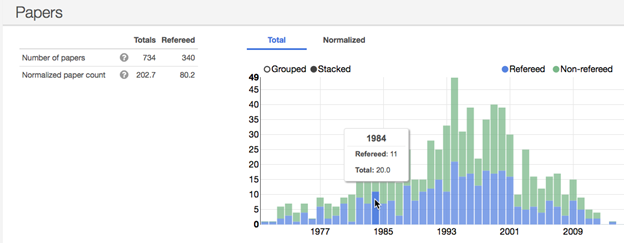
Use this panel as a sanity check that your search is selecting the publications you are interested in, since all of the indices are calculated based on this set. On the left side of the panel, the total number of publications and the number of those which are refereed are listed. On the histogram, you can mouse over any data point to see the actual values. The first result set is for the default amount of publications (300). If you have more, you can specify that number in the box at the top of the overview (up to the maximum of 2,000). We expect to be able to increase this maximum at some point in the future.
There are panels that display information about Citations and Reads, but let’s focus on the Indices. The panel illustrates the values of various indices on any given year.
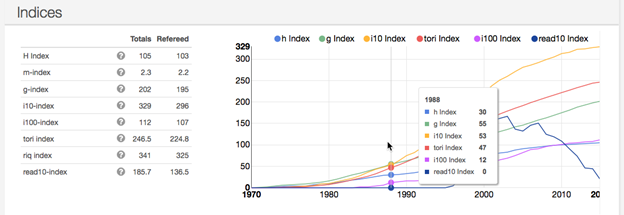
On the left, the present value of many popular indices are calculated. Mouse over the help icon next to each index to get a brief description of how it’s calculated.
In the near future, you will be able to save/print the pages showing the metrics overview. In addition, we will provide permanent links to the metrics results pages so that these results can be more easily shared.
Please don’t take the inclusion or exclusion of a particular index as an indication on our part of its usefulness. For example, one of the most popular and widely used metrics is the h-index. It is also a highly controversial index. Using one metric to describe productivity is like using one moment to characterize a probability distribution, so please take these numbers with a grain of salt. If you are interested in these topics or are on any search committees, we encourage you to explore some more esoteric indices such as the read10, tori, and riq, which have been invented by our own team members.
These metrics are also available through our API, for those of you who want to access them programmatically. Details about our API can be found in the github repo and on the discussion group.
We’re eager to hear how people like this tool and what other functionality you’d like to see in the future. Please let us know in the comments, contact us by email at adshelp@cfa.harvard.edu, or Tweet at us @adsabs.
While citation statistics are easy to calculate and tempting to use for evaluation, we need to think critically about their use.
Here’s one good critique: http://arxiv.org/abs/0910.3529
“There is a belief that citation statistics are inherently more accurate because they substitute simple numbers for complex judgments, and hence overcome the possible subjectivity of peer review. But this belief is unfounded.”
Totally agree. Reading a paper is still the best metric.
I think that’s a great tool! when a colleague showed it to me a few weeks ago, I spent quite some time exploring. I see some easy and not so easy improvements. An easy one would be to have comparable scales for the indices: having some in the 1’s and others in the 100’s makes the plot quite useless (let say if you compare read10 and i100).
I read the paper you quote and I was happy to see something I suspected since long: the h-factor of people working in different fields are not easily comparable. A feature I would love to see it to somehow show, for a given author, the group of authors who work in the same field (same keywords in publications, within the network of cited papers, etc.) and with the same age (i.e. same date of first publication).
Again, great tool!
Thanks for the praise and the suggestions, Antoine.
I am working on just that “author” feature you mention! Author disambiguation will be very helpful for this to really work well, and that is something we will be addressing at some point. Please email us if you have more suggestions. ADS Bumblebee is still “beta”, so there are bound to be bugs and we would love to hear about them.
Nice tool, although trying to calculate statistics for applicants with non-unique author names is still an issue. Would be nice if people could self define their own publication lists and save it somehow on-site, that way a search on a unique username they choose would get their papers.
also, may I suggest adding a normalized h-index and first author h-index (or similar stats)
We are working on the problem of author ambiguity. First author metrics are simple: do the first author query and then get the metrics.
Very nice tool! One thing I might suggest is the ability to limit statistics to only first-author papers (or only when the person of interest is in the top N authors or something like that). Otherwise, for members of large collaborations the numbers get pretty crazy very quickly!
First author metrics are simple: do the first author query and the get metrics. For large author list, the normalized metrics are more useful.