Angelo Zinzi is a postdoc at ASI Science Data Center (ASDC) and Astronomical Observatory of Rome (INAF-OAR). His work at ASDC includes the development of a multi-platform, flexible tool for accessing, analyzing and visualizing data from planetary exploration missions.
MATISSE (Multi-purpose Advanced Tool for the Instruments for the Solar System Exploration) is a tool developed by ASDC since early 2013, with the purpose of improving both the accessibility of planetological data and visualizing them directly on the 3D shape model of the selected object. As of now, MATISSE can ingest data from 6 targets (the Moon, Mercury, asteroids 4 Vesta and 21 Lutetia, comet 67P Churyumov-Gerasimenko and dwarf planet 1 Ceres) and, thanks to a database, it is possible to perform queries based on temporal, geographical (latitude, longitude) and geometrical metadata (incidence, emission and phase angles).
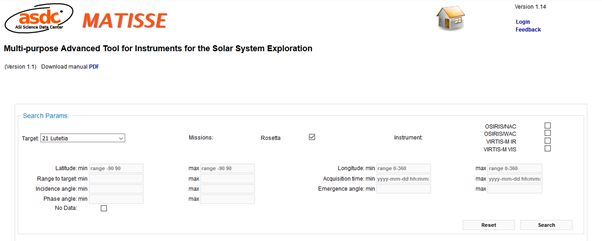
Figure 1: MATISSE Homepage
Its modular structure also allows the tool to be extended to other datasets, and the possibility to connect to external repositories, using standards such as those of Planetary Virtual Observatory and NASA ODE REST API, is in its initial phase. Currently NASA ODE REST API has been used to provide access to NASA Messenger MDIS-NAC observations of Mercury, which can be searched and accessed directly from MATISSE.
MATISSE generates higher-order outputs, such as false colors (RGB), ratios, mosaics, and differences, computed on demand starting from the single observations available in the archive. All its outputs can be viewed directly on the web (in 3D and 2D) or downloaded for offline use with external software (i.e., 2D FITS, GeoTIFF and ENVI; 3D Paraview).
To access MATISSE, go to its homepage and follow the instructions described in the User Manual. Here you can find the published paper on Astronomy and Computing here (along with the ArXiv link).
Tutorial
For first-time users, I have included an example using the asteroid Vesta. From the homepage, select “4 Vesta” as the target and “VIR IR” as instrument. Then fill the latitude and longitude fields of the search form with the values Lat Min = 25, Lat Max = 40, Lon Min = 48, Lon Max = 63 and the click the “Search” button (you can of course change all these settings). Scroll down to find the list of observations that fulfill these criteria. From this list, click the third observation from the top. From the Wavelength drop-down menu, select “5005.37” and “Red temperature” as the color palette since the 5 micron band is best suited for thermal analysis.
Once you have done this, click on the “Submit” button, and be patient while your image loads as it will take a few minutes. (Editor’s note: use this time to refill your cup of coffee, or look at more pictures of cats or corgis on the Internet, which is what you were probably doing anyway.) Once the images load, you will see an interactive 3D window (click and drag to manipulate the image) on the left, and two 2D images projected images (one zoomed to the selected area and one showing a global map of the object), as shown in Figure 2, though with a different target.
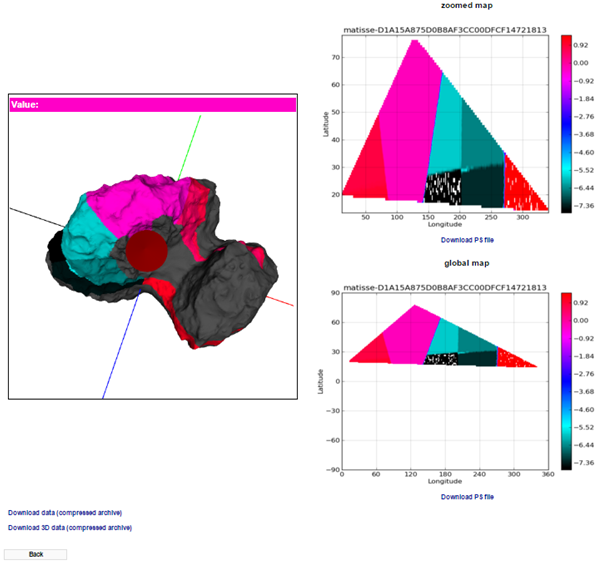
Figure 2: Example of web visualization of data from comet 67P Churyumov-Gerasimenko.
The 2D images will each have download links to the postscript files for the respective images. At the bottom right of the page, you can also find download links for the 2D and 3D data files. These will give you TGZ compressed folders containing 4 and 2 files, respectively. The 2D folder contains a GeoTIFF image, an ENVI IMG+HDR pair, and a readme text file. The 3D folder contains a VTP file that can be opened with Paraview; an example image is shown below.
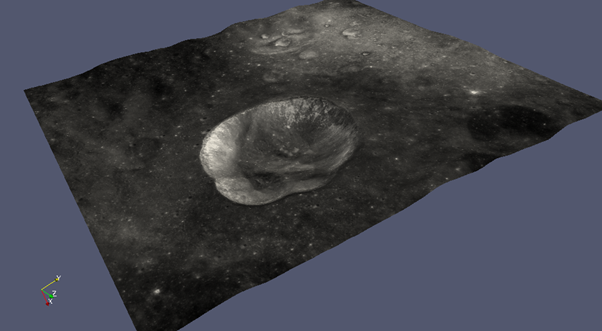
Figure 3: High resolution, offline visualization (Paraview) of a lunar crater, using Chinese Chang’e 1 data.
Happy viewing!