Growing up by the mountains of Northern Greece, Hercules (aka Iraklis) Konstantopoulos developed a fascination with the night sky and all its intrigue. After a career as a researcher in astrophysics that spanned ten years and four continents, he became drawn to addressing a greater variety of data-related problems. Data science ensued with work on sustainability and energy management, and now a spot as Sr Data Scientist at Atlassian, Sydney’s most acclaimed home-grown tech shop. There he focuses on converting support tickets and behavioural data into product strategy and business direction, and on creating informative and accessible data visualisation. This post is cross-posted from Dr. Konstantopoulos’ website.
In a past life I was a researcher in Astrophysics. I spent a decade or so in academia, a pretty tough field ruled by the old adage of having to publish or perish.
Publications and citations are the only primary, quantitative success metrics for a doctoral student or a postdoctoral researcher. Like every system that relies so heavily on metrics, researchers (as a group) tend to game publication and citation rates in order to advance in this very bumpy playing field.
One stereotype surrounding young researchers is that they publish more articles at the cost of quality. Another noticeable effect is the lengthening of author lists in recent years. Opinions are mixed on whether these are inherently negative effects, but there is some consternation expressed, particularly by more established academics, about dilution of quality.
How warranted are these complaints? Can we quantify the change in author lists over time? And can we tease out any effects on the impact of a paper?
To find that out I used the API offered by the NASA Astrophysics Data System (ADS) to fetch the author list of every paper published in Astrophysics since 1900.
How many papers, you ask? Yeah, a bunch… Around one million papers, to be exact.
Just how much has traffic increased?
“I can’t keep up with all this literature” has been a commonplace complaint for a while now. Every field is expected to grow over time, but an individual can still only parse so many papers. This focuses researchers into sub-fields, which increases depth but reduces breadth. That isn’t a bad thing, it is just a different mode of operation.
Fundamental change can bring about some existential dread, and Astrophysics is experiencing a bit of that. It is typical for researchers today to follow the daily cadence of article releases in order to keep up only with their subfield. There is living memory, however, of a time when a researcher in a subfield of Physics could keep up with the entirety of Physics.
Let’s have a look at the total number of Astrophysics papers as an indication of the overall size of this field.
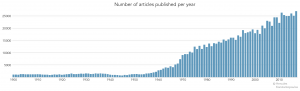
That’s quite a picture! We may be observing the Cold War add resources to Space Science as the ramp-up through the 1960s. The proliferation of articles in the 1970s is largely due to the advent of the charged-couple device (CCD). This gadget revolutionised astronomy about 40 years before it transformed photography: it is the miniaturised detector that allows your smartphone to take beautiful, crisp, digital photos.
With this steady increase in publications after five decades of stability, I am curious to find out the centre of mass for this timeline: there will be a year that divides the overall number of articles roughly in two.
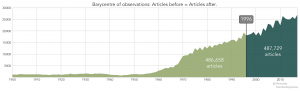
In the timeline of 1900 to 2018 that year is 1996. That is, the last sixth of the timeline accounts for half the activity. I find that wild! It implies that recently minted researchers operate in a fundamentally different terrain that those who got their PhDs before 1990, and an entirely different world to those who academically came of age by 1970—the esteemed emeriti of their institutions.
Have author lists appreciably inflated over time?
The short answer is yes.
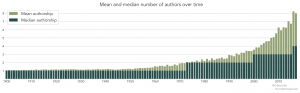
The median number of authors remained at one for the first ~70 years of this timeline. It climbed to two and only stayed there for 30 years, only to last at three for a mere 15 years. One might expect four by 2025 . The mean has seen a huge inflation since the turn of the millennium, drawn out by enormous collaborations in the style of Particle Physics.
Fewer and fewer papers are written by individuals or small groups.
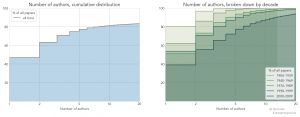
The stretching author lists make it clear that we need to bundle into a few discrete eras before we can delve into details. In the following chart I aggregate these numbers into a cumulative histogram: each step (bin) includes all the data for the one before it.
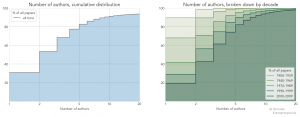
Cumulative histograms show what proportion of the whole population we are covering as we sweep in one dimension. In this case the proportion of all papers (in each period) that were authored by one, two, three, twenty people. The aggregate over all time stops shy of 100% as roughly ~5% of papers have more than 20 authors.
The breakdown over eras show a staggering variation, and a monotonic evolution: fewer and fewer papers are written by individuals or small groups of authors.
We can slice this a different way to more specifically visualise the length of author lists as it changes over time. First we map the number of articles of N authors over time.
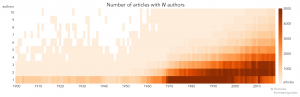
Read the above in horizontal bands: e.g., between 1970 and 1995 there were 5000 papers a year with a single author.
Second we have the proportion of articles with N authors—read this in vertical bands.
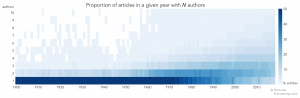
From 1900 all the way to 1970, single-author papers represented over 50% of the whole for the year. After 1970 there isn’t such a dominant mode with papers spread thin vertically.
Impact factors
Articles are published in journals and they are cited by other researchers. Not all journals are considered equal: the prestige of a journal is determined by its impact factor, roughly the number of citations their articles get on average. One such definition of impact is CiteScore. The next chart shows the lay of the land for journals where Astrophysics papers are routinely published.
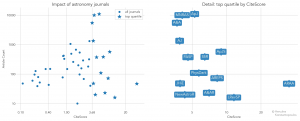
There are some high-profile journals and a bulk of lower-impact publications. Annual Reviews is the runaway champion here. I do not include Nature and Science, the world’s premier multidisciplinary science journals, because I want to compare Astronomy journals consistently among their peers.
Going back to the perception that quality and quantity are at odds, one immediate observation is that prestigious journals publish just as many articles as the rest. In fact, the three journals that publish the most are in the top quartile by CiteScore.
Of course we are covering a huge timeline here. Have astronomers’ attitudes toward citation changed? Yeah, leading question:
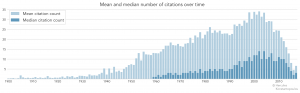
The slump after the turn of the millennium illustrates a delay effect: it takes a long time to rack up more than a couple dozen citations.
Contemporary astronomers publish more and cite others more often.
Again, if quantity dilutes quality, articles in these prestigious journals should have a smaller median author list and fewer papers with many authors. That is not the case:
Median values N authors CiteScore Article count
Top quartile 3 4.09 9967
Bottom three quartiles 2 1.23 422
Over all time, top-tier journals publish more papers with longer author lists.
Let’s look at trends over time. What happens to our previous plots if we restrict to high-impact publications?
While we do get a higher proportion of single-author papers in high-impact journals, the overall distribution extends to a longer tail of many authors.
In the breakdown over time we see stronger clustering than in the overall population where we saw strong divergence. But the trend over time, toward more authors is still strong.
Let’s summarise this part. Top-tier journals:
- feature a higher proportion of single-author papers
- publish more articles by an order of magnitude
- feature significantly longer author lists (P≈0.0)
So, what have learned? If we accept that impact factors track quality we can reject the hypothesis that quantity dilutes quality.
Authorship as a decider for citation count
So far this is clear as mud… Up is down, good is bad, and your grandmother’s cooking is kinda meh.
What if we get rid of the middle man? We are trying to relate the length of an author list to the impact of the article. How do the two quantities plot against each other?
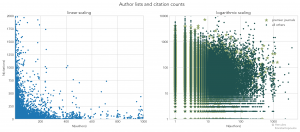
At first glance we seem to have an exponential drop-off in citations as the author lists become longer. Scaling both axes by their logarithms we can get a clearer picture, which is what we have on the right. Nothings jumps out of this picture, perhaps a shallow decline of the citation rate with increasing author list length.
Let’s just throw these into a regression model and see what happens. The simplest model, N(citations) ~ β * N(authors), should not be expected to perform very well given the exponential relation, but I’ll show it here for reference. The R-squared value suggests that we explain about 0.3% of the variance this way. We get a y-intercept at 20 citations and a coefficient β=0.2. This means the typical paper gets a very sporting start with 20 citations and gains roughly one citation for every five added authors.
A log-log model is more appropriate: log N(citations) ~ β * log N(authors). Yet this only explains 2% of the variance. We get a (log10) intercept of 0.91, that is 8 citations, with 1.8 citations added for each 10 authors. So the slope is shallower when we apply a more fitting relationship.
The number of authors has no predictive power over citations.
While the trend is positive the regression models state that the number of authors is of no use as a predictor of citation count. This persists if we perform over past timelines, e.g., papers published before 1950. We did learn above that the number of authors has been inflating recently and it stands to reason that it takes a while for a paper to gain popularity and rake in those citations.
Alas, we have no timeline of citations for individual papers so we cannot test this. But we can caution against over-interpreting the apparent decline toward the right of the log-log plot: many massively multi-author papers are recent and have not had the time to get those cites.
Great, there are more papers. So what?
Publications do not cover the full gamut of research activity. As an example, I spent most of my last postdoc helping to build an instrument for the AAT, a wonderful telescope near Warrumbungle National Park in New South Wales, Australia. This instrument was used to conduct a large survey and hugely benefited the global science community.
That’s great, right? Well… that building activity dampened my publication rate from one or two first-author papers per year to about one in two years. Oops ¯\_(ツ)_/¯
How do we ensure that young researchers are not disadvantaged by doing work of great community value through these massive projects? We reward them with publications. Yay! How? We grant them inclusion to every paper the project produces. This is a reasonable way to restore balance to the CVs of these individuals, but it brings us back to the effect of publication list inflation.
The way I have perceived this disgruntlement over the years it all hinges on the number of publications, and the number of authors. The feeling is that papers are devalued by long author lists, and that liberal inclusion of coauthors is harmful to the research field of Astrophysics.
We have learned that there is no link between the length of the author list and the number of citations. Does this mean we can look past this now?